Pepe Price Prediction 2026: Rally Signal or Warning Sign?


The meme was supposed to be dead. Everyone said so. The threads moved on, the influencers found new tickers to shout about, and PEPE quietly slipped off the trending list.
But something strange kept happening. Wallets kept showing up. Not in a loud, announcement kind of way. Slowly. Steadily. Like someone was accumulating while nobody was watching, and every Pepe price prediction from six months ago was starting to look embarrassingly conservative.
Then came May. One candle changed the whole conversation: a spike that caught even the bulls off guard, a level nobody had circled on their chart, and then a pullback that left traders staring at their screens wondering if they just missed it or if the real move hasn't even started yet. Every pepe price prediction made before that candle suddenly needed a rewrite.
That's the question sitting over the PEPE price prediction right now. And the chart, for the first time in months, is starting to say something worth listening to.
Pepe Price Today: Key Market Data
Before mapping out the prediction numbers, here's where PEPE price prediction actually stands right now.
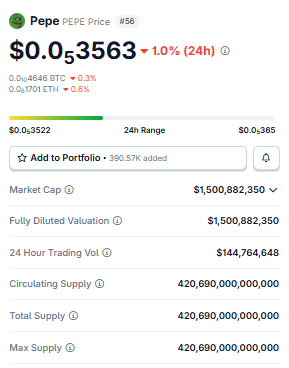
Source: Data by CoinGecko
Current price: approximately $0.00000358
Market cap: $1,500,882,350
24-hour trading volume: $144,764,648
Circulating supply: 420,690,000,000,000 PEPE (fully diluted, no additional tokens)
No new supply is coming. The max supply is fixed at 420.69 trillion tokens.
That's actually a structural advantage: there's no inflation pressure from new token releases to fight against.
Pepe Liquidation Map: What Leverage Is Doing
The leverage picture tells a story the spot chart doesn't. When we looked at the liquidation data, it confirmed exactly what the bearish EMA crossover suggested: the market is flushing out overexposed longs.
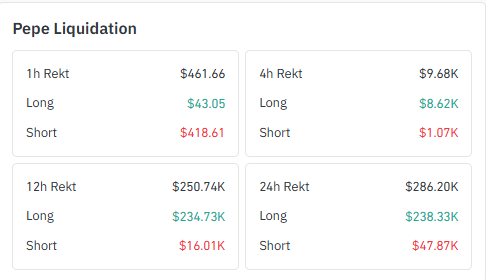
Source: Data by coinglass
Pepe liquidation data (24h): 286K long liquidations, 238K short liquidations, 47K
1-hour: $461.66 total, with $418.61 from short liquidations
4-hour: $9.68K total, with $8.62K from longs
12-hour: $250.74K total, with $234.73K from longs
24-hour: $286.20K total, with $238.33K from longs and only $47.87K from shorts
That 24-hour split is lopsided. Longs are getting liquidated at roughly 5x the rate of shorts. That flush needs to clear before a clean move higher is possible.
But here's the thing: once the overleveraged longs are wiped out, the residual sell pressure from forced liquidations also disappears. That's often when the real move begins.
Reading the Chart Before the Next Move
When we pulled up the daily time frame for PEPE/USDT on TradingView, the first thing that stood out was that ascending trendline.
Multiple times the price came down, took support from the ascending trendline, and reversed; currently the price has been hovering above the line for the last 2 - 3 days.
If the price takes support again, the price will reverse from here; else, the trendline will break, and the price will come more down.
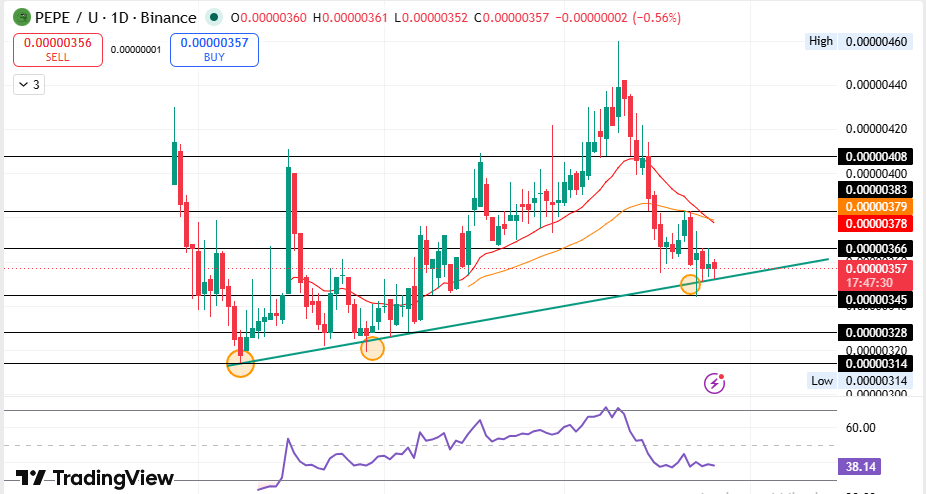
RSI is at 38.14, hovering at the edge of oversold without fully tipping in. The 20 and 50 EMAs are crossing bearishly, which means the medium-term trend is downward pressure.
But here's what most traders are missing: ascending trendlines that hold three times don't usually break quietly.
If it holds here, the recovery could be sharp. If it breaks, there's real air below. The chart doesn't lie. It's just not making the decision easy.
Key Zones to Watch
Entry zone (bulls): $0.00000345–$0.00000366, trendline support, tested 3x before
Immediate resistance: $0.00000378–$0.00000383
Next resistance: $0.00000408, prior aggressive selling zone
Short-term target: $0.00000393–$0.00000408
Long-term target: $0.0000046 retest or higher
The longer the price compresses at this trendline, the bigger the move in either direction.
PEPE Price Prediction 2026 Scenarios
Bull Case: The trendline holds, the RSI curls up, and volume returns.
Mid-2026 target: $0.00000393–$0.00000408.
Year-end: $0.0000050–$0.0000060.
Bear Case:
Break below $0.00000314.
Next support: $0.00000280.
Year-end recovery target: $0.0000032–$0.0000040.
Bearish Signals to Watch
RSI at 38.14 bearish, not yet oversold
20 & 50 EMA bearish crossover sellers in short-term control
Long liquidations: $238K vs $47K shorts longs getting squeezed
May ATH at $0.0000046 acted as rejection
The Longer Game: 2027 and Beyond
Zooming out, the Pepe price prediction into 2027 depends almost entirely on whether PEPE maintains its cultural relevance. And so far, it's done exactly that.
Meme coins with genuine community depth, organic social activity, and a growing holder base don't typically die clean deaths. They compress, get forgotten, and then explode back when the narrative rotates.
If crypto bull momentum continues into 2027 with regulatory clarity improving in the US and EU, PEPE's upside case extends meaningfully. A range of $0.0000080 to $0.00000120 by the end of 2027 represents the optimistic scenario.
The pessimistic one involves a prolonged bear market dragging the PEPE price prediction toward $0.00000200 before any meaningful recovery.
And that raises a bigger question : one the market hasn't answered yet.
Is PEPE's holder growth a leading indicator or a lagging one?
Or are they retail holders who bought at various levels and simply haven't sold yet?
The chart won't tell you that. But the behavior of price at this trendline over the next two weeks will.
Why Bulls Are Still Holding On
The bull case for PEPE price prediction in 2026 isn't complicated, but it's also not guaranteed. A few things are worth laying out plainly.
Social sentiment on X is still organic. The technical analyst fuelkek (post on @fuelkek) points out PEPE's silent holder growth while the timeline moves on.
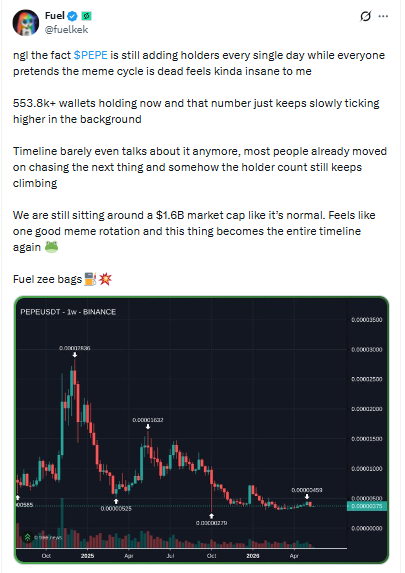
That's exactly the kind of content that eventually triggers a viral moment.
The ascending trendline has held three times. That's not a coincidence. Three touches makes a level real.
Meme coin narratives move in waves. Bitcoin dominance has been elevated, but the moment BTC consolidates, capital rotates into meme coins first. PEPE price predictions sit at the top of that rotation list.
Final Word: Worth the Risk in 2026?
The setup is more interesting than most are giving it credit for
Price takes support from trendline, 553K+ holders, a $1.5B market cap that has simply refused to collapse, and a chart sitting at exactly the decision point.
That's not nothing. But the RSI at 38.14 with a bearish EMA crossover means momentum hasn't turned yet. Watching for confirmation of a trendline bounce, then entering with a clear stop below $0.00000314.
Whether PEPE is a good investment in 2026 depends entirely on which side of that trendline we're on three weeks from now. The chart is telling us to pay attention.
Whether it's telling us to buy? That answer's coming soon.
DISCLAIMER: This article is for educational purposes only and does not constitute financial advice. Crypto markets are highly volatile. Before making any investment decisions, consult your investment advisor.
Also read:

















