Polkadot Price Prediction August 2026: $DOT Bearish Flag and Pole?


$Polkadot is quietly retracing after a sharp drop, and the shape of that drop on the chart is what's getting attention right now.
$Polkadot is a multi-chain network built to let independent blockchains, called parachains, share security and communicate with each other, according to its own project materials.
This Polkadot Price Prediction August 2026 looks at what a possible bearish flag and pole pattern means for DOT's next move and whether the psychological $0.70 level can hold.
Here's the full breakdown, including this month's Polkadot price prediction today and where things could head next week.
Polkadot Price Prediction Today: Market Overview
Metric | Value |
Price | $0.7626 |
24h Change | -0.46% |
Market Cap | $1.29B (+0.62%) |
Unlocked Market Cap | $1.32B |
24h Volume | $78.87M (−16.41%) |
Vol/Mkt Cap (24h) | 6.09% |
FDV | $1.6B |
Total Supply | 1.69B $DOT |
Max Supply | 2.1B $DOT |
Circulating Supply | 1.69B $DOT |
Profile Score | 71% |
Source: Data from CoinMarketCap as of 30/07/2026. Figures may vary slightly across other tracking websites.
Polkadot Token Unlocks and On-Chain Network Data
Recent token unlock schedules and on-chain activity are becoming key drivers of $Polkadot's short-term price action. These metrics help assess potential selling pressure, network growth, and investor sentiment ahead of August 2026.
Polkadot Price Prediction August 2026: Polkadot Token Unlocks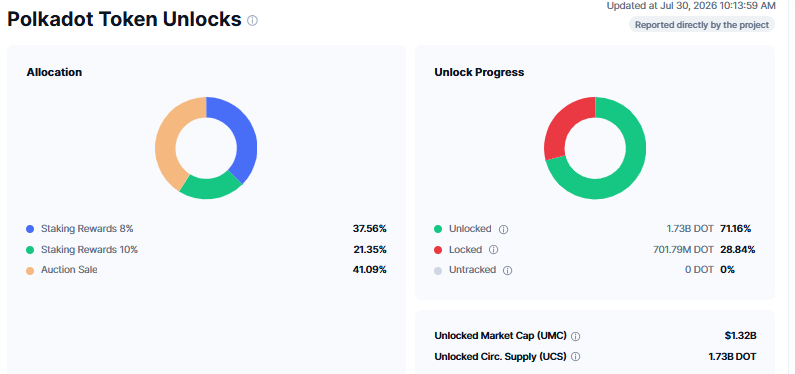
Polkadot's token allocation splits across three buckets: Auction Sale at 41.09%, Staking Rewards (8% tranche) at 37.56%, and Staking Rewards (10% tranche) at 21.35%. Of the total supply, 71.16% (about 1.73B DOT) is already unlocked.
While 28.84% (roughly 701.79M DOT) remains locked, putting the unlocked market cap at $1.32B as of the July 30, 2026, update.
Polkadot Price Prediction August 2026: Polkadot Chain Data 
On-chain activity remains active: $Polkadot has processed 32,330,036 finalized blocks and 42,325,420 signed extrinsics to date, with 39,660,608 total transfers recorded and 67,982,658 total accounts on the network, per Subscan data.
DOT Price Prediction: Chain Status Chart & Token Distribution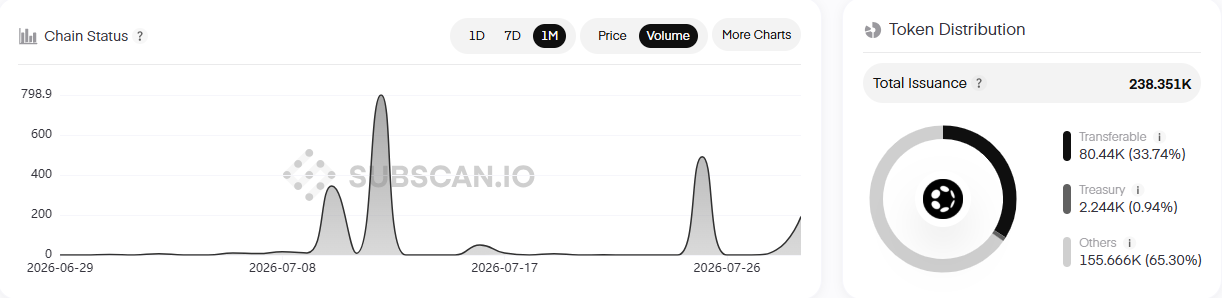
The 1-month on-chain volume chart shows several sharp spikes in mid-to-late July, suggesting bursts of network activity rather than a steady climb.
Of $Polkadot's total issuance, 33.74% is transferable, 0.94% sits in treasury, and the remaining 65.30% falls under other allocations, per Subscan's token distribution breakdown.
Polkadot Technical Analysis: Bearish Flag and Pole Pattern
Pair: DOT/USDT · Market: Spot (KuCoin) · Timeframe: 4H · Source: TradingView · Timestamp: July 30, 2026, 10:43 UTC+5:30
DOT trades at $0.7626, down 0.46% on the candle, after a sharp, near-directional drop from around $0.8278 to the $0.76 zone.
That drop is the "pole" in what looks like a bearish flag and pole setup, a continuation pattern where a steep move (the pole) is followed by a tight, sideways-to-slightly-upward consolidation channel (the flag).
If the pattern plays out, the prior downward move is expected to resume once the price breaks below the flag's lower boundary, rather than the consolidation marking a reversal.
Price is currently consolidating inside that flag, trading below both the EMA 20 ($0.7735) and EMA 50 ($0.7950), which now sit as overhead resistance after the drop.
RSI (14) at 35.25 is below neutral and has been trending down, reflecting weak momentum without yet being oversold. Below the current price, $0.70 stands out as a psychological support level, while $0.6531 lines up with a 1.618 Fibonacci extension support.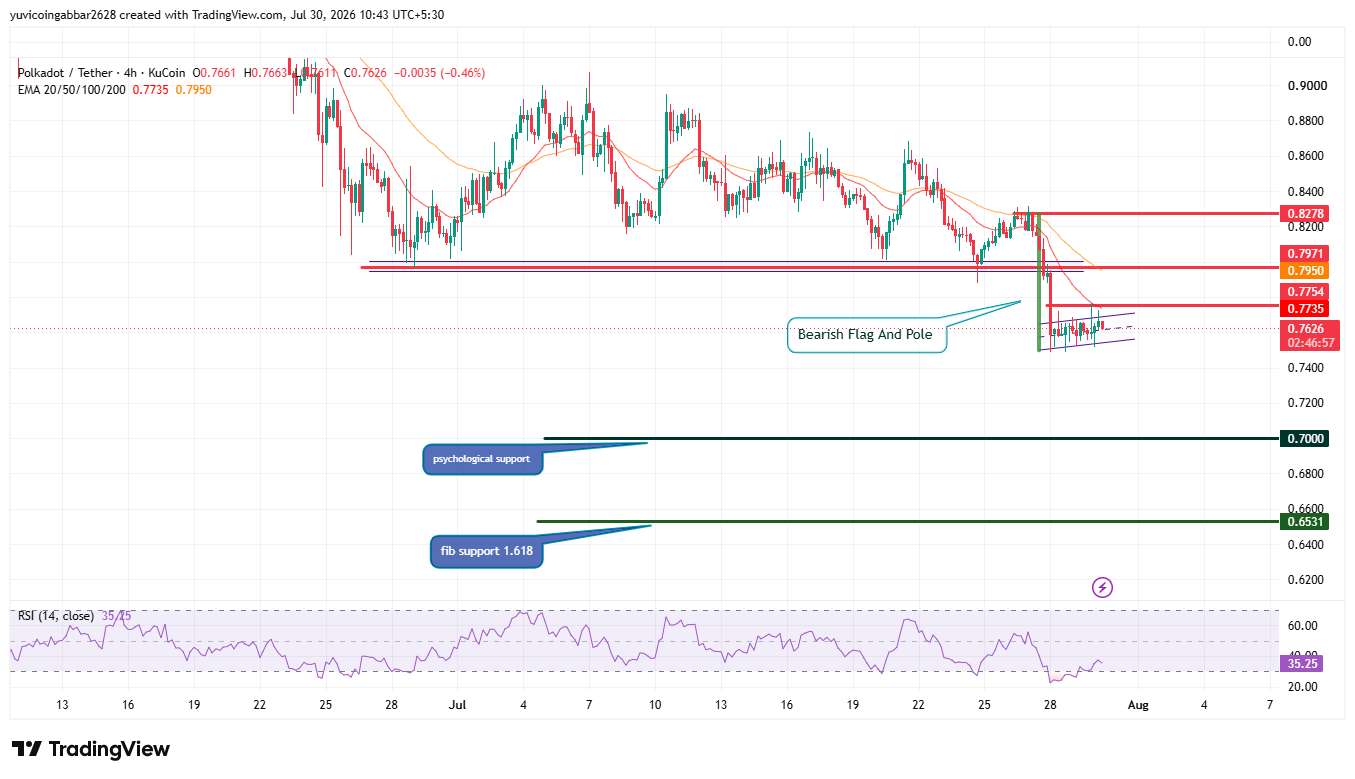
Level Type | Price | Label |
Resistance 3 | $0.8278 | Prior breakdown level |
Resistance 2 | $0.7971 | Flag pole origin zone |
Resistance 1 | $0.7754 | Near-term resistance |
Initial Recovery Level | $0.7950 | EMA 50 |
Immediate Price Reference | $0.7626 | Current price |
First Confirmed Support | $0.7000 | Psychological support |
Deeper Support | $0.6531 | Fib extension 1.618 |
DOT Short-Term Forecast: Bull Case vs. Bear Case
Bull case: If DOT holds above the channel and clears $0.7754, the next Resistance will be the EMA 50 recovery level near $0.7950, with a stretch move toward $0.7971–$0.8278 if the flag breaks upward instead of down.
Bear case: If the bearish flag and pole pattern confirm with a break below the current consolidation, DOT could retest the $0.70 psychological support first, and a failure there opens a path toward the $0.6531 fib support zone.
Can Polkadot Price Prediction August 2026: Reach $1 in 2026?
A move back to $1 would require DOT to first clear the EMA cluster and the $0.7950–$0.8278 resistance band, reversing the current bearish flag structure entirely.
That's a meaningful shift from the present setup, so it would likely need broader market strength alongside renewed DOT-specific demand rather than a technical bounce alone.
What Is the Polkadot All-Time High and Can It Be Broken?
DOT's all-time high sits well above current levels from the 2021 market cycle.
Reclaiming that high would require a sustained multi-month uptrend far beyond the current chart structure, making it a long-term question rather than something the present bearish flag setup speaks to directly.
DOT Price Prediction: Expert View: Polkadot Price Analysis
According to CoinGabbar analysts, Polkadot's chart is flashing a textbook bearish continuation setup right after a sharp drop, with RSI at 35.25 confirming weak short-term momentum.
At the same time, network fundamentals look steady—unlock progress is on schedule, on-chain activity remains active, and token distribution hasn't shifted unusually.
The near-term question is technical, not fundamental: whether the $0.70 psychological support holds or whether the flag-and-pole pattern completes to the downside.
Disclaimer: This article is for informational purposes only and should not be treated as investment advice. Cryptocurrency markets are highly volatile, and readers should conduct their own research before making any financial decisions.









.jpg)








