Popcat Price Prediction: Whale Activity Signal a Critical Week Ahead


What Is Happening With Popcat Right Now
Popcat price prediction is the one search every POPCAT holder is running this week, and honestly, they're right to.
Something is building. The chart is compressing.
Whales are quietly loading bags . And the kind of tension that shows up right before a big move? It's sitting right here, right now.
Nobody's talking loudly about it yet. But the setup is already in motion.
A Quick Look at Popcat Before We Get Into the Chart
Popcat is a Solana-based meme coin, born from that viral cat meme that took over the internet. There's no complex utility here, no whitepaper, no staking rewards.
It runs on pure community energy, and that's always been its edge. When the crowd believes, POPCAT moves. Simple as that.
The total supply is capped at 979.98 million tokens. Market cap sits around $51.4 million right now.
Small enough to move violently. Big enough to attract serious money. And that combination is exactly why the Popcat price prediction debate keeps coming back every few weeks.
Why People Still Believe In Popcat
Communities don't stick around for nothing. The Popcat crowd has held through multiple brutal corrections, and they're still here. That's not blind faith; that's conviction.
And when we start seeing whale wallets step in quietly at these levels, the conviction starts making more sense.
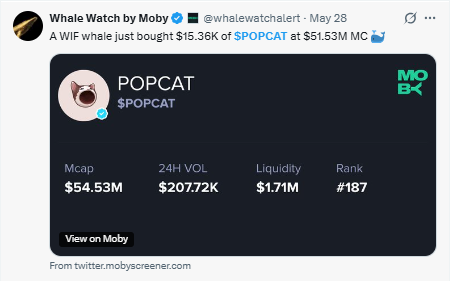
Whale Watch by Moby flagged a $15.36K buy from a WIF whale at a $51.53M market cap just days ago.
Quick Numbers At A Glance
| Field | Detail |
|---|---|
| Token Name | Popcat |
| Ticker Symbol | POPCAT |
| Blockchain | Solana |
| Current Price | $0.0529 |
| Today High | $0.0533 |
| Today Low | $0.0520 |
| RSI Level | 49.54 (4H) |
| Token Type | Meme Coin |
Source: Data By Coingecko
What the Popcat Chart Is Actually Telling Us
Price doesn't compress like this for no reason. When sellers get tired and buyers start absorbing every dip quietly, the chart tightens. That's exactly what's been happening with POPCAT.
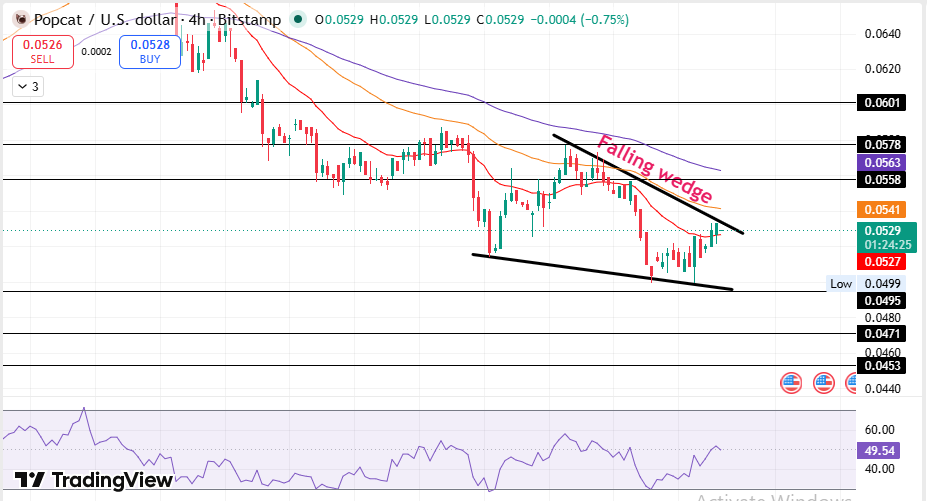
Source: By TradingView
POPCAT price touched the lower band of the falling wedge and bounced back. That bounce wasn't random. Buyers showed up right where the wedge demanded they show up.
And now the price is trading near the upper band of the falling wedge. This is the moment. Either POPCAT breaks out of this wedge or it gets rejected and slides back down. That's the only question that matters right now.
Each high came in lower. Each low held just a little bit better. The range kept shrinking. And now it's squeezed to the point where something has to give.
The EMA 50 and EMA 100 are sitting above price like a ceiling. The EMA 20 is right near current levels, almost undecided.
RSI is at 49.54. Neutral. No extremes. That means the next move hasn't happened yet, and there's real room to travel in either direction. Whales noticed first. They usually do.
Here's what traders are missing: The Popcat price prediction only shifts decisively if the price can close above $0.0558 with real volume behind it. Without that, it's still just a coil. And coils can snap either way. Risk is still real.
Popcat Price Prediction: Three Scenarios for 2026
Bear Case $0.0453 to $0.0471: If buyers lose their grip and $0.0495 breaks on volume, the Popcat price prediction turns fast.
A broader crypto pullback or Solana-specific pressure could push it down to this zone. This is the level where real damage happens to sentiment.
Base Case $0.0558 to $0.0601: This is the most realistic Popcat price prediction path right now. Pattern breaks with volume, short-term structure flips, and price works its way through $0.0558, then $0.0578, toward $0.0601.
Requires a stable macro backdrop and continued accumulation from the bigger wallets.
Best Case $0.0601 to $0.0800: The Popcat price prediction that bulls are dreaming about. A clean break above $0.0601, EMA 100 flipped from resistance to support, and a full meme coin season is igniting across Solana.
| Scenario | Price Range | What Triggers It |
|---|---|---|
| Bear Case | $0.0453 – $0.0471 | Wedge breakdown, BTC selloff |
| Base Case | $0.0558 – $0.0601 | Breakout with volume, whale support |
| Bull Case | $0.0601 – $0.0800 | Meme season |
Three Price Levels Every Trader Should Watch
Support $0.0495
Buyers have defended it. Losing it with a daily close below changes everything for the Popcat price prediction near term.
Resistance $0.0558
This is the line that decides the short-term story. A confirmed 4H close above here is the signal most traders are waiting for.
Invalidation $0.0471
A daily close below this level breaks the bullish Popcat price prediction structure entirely. Below here, the base case is off the table.
What Analysts Are Saying Right Now
When we pulled up the RSI, the first thing that stood out was how neutral it is at 49.54.
That's not a screaming buy signal. But combined with the pattern compression and fresh whale activity, it leans more interesting than most are giving it credit.
Analysts tracking Solana meme coins are pointing to the same playbook that set up the last move: a controlled dip, quiet accumulation, then a sharp break.
The Popcat price prediction structure is mimicking that setup right now.
A weekly close above $0.0495 keeps the bullish case alive.
The one external factor to watch?
Bitcoin's next weekly close. It decides the mood for everything.
And that raises a bigger question: is the meme coin rotation really back, or is this just noise before another leg down?
The market hasn't answered that yet.
Final Thoughts
The most important level right now is $0.0558. That single close decides whether the Popcat price prediction turns active or stays on hold.
Whale buying below $0.0530 is real. The accumulation pattern is real. But until the chart confirms, it's still a setup, not a breakout.
Basically, the structure is there. The move hasn't happened yet.
Wedges don't lie. But they do make you wait.
Disclaimer: This article is for educational purposes only and does not constitute financial advice. Crypto markets are volatile. Consult your investment advisor before making investment decisions.
Also read:

















