Siren Price Prediction: $SIREN Next Explosive Rally Levels, Upcoming?


Siren is a token built around AI-driven trading and market analysis tools, with a highly concentrated holder base where whales control nearly 96% of total supply.
This Siren Price Prediction looks at whether the recent consolidation above its descending channel breakout resolves higher or gives way to further downside over the next one to two weeks.
Here's what the chart and holder data show.
Siren Price Prediction Today: Market Overview
Metric | Value |
Price | $0.02728 |
Market Cap | $20.66M |
FDV | $20.66M |
24h Volume | $2.27M |
Vol/Mkt Cap (24h) | 10.62% |
Liquidity/Mkt Cap | 13.18% |
Total Supply | 723.97M $SIREN |
Circulating Supply | 723.97M $SIREN |
Holders | 69.39K |
Source: Data from CoinMarketCap as of 4/08/2026. Figures may vary slightly across other tracking websites.
Siren Holder Distribution: What It Means for Price
SIREN has a max total supply of 1,000,000,000 tokens, 69,535 holders, and more than 21.8M total transfers to date.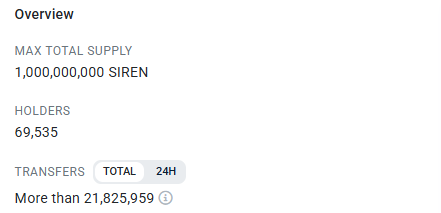
Holder concentration is notably heavy: the top 100 holders control 92.22% of supply, and whales, who make up just 0.46% of all holders, control 95.93% of total supply. 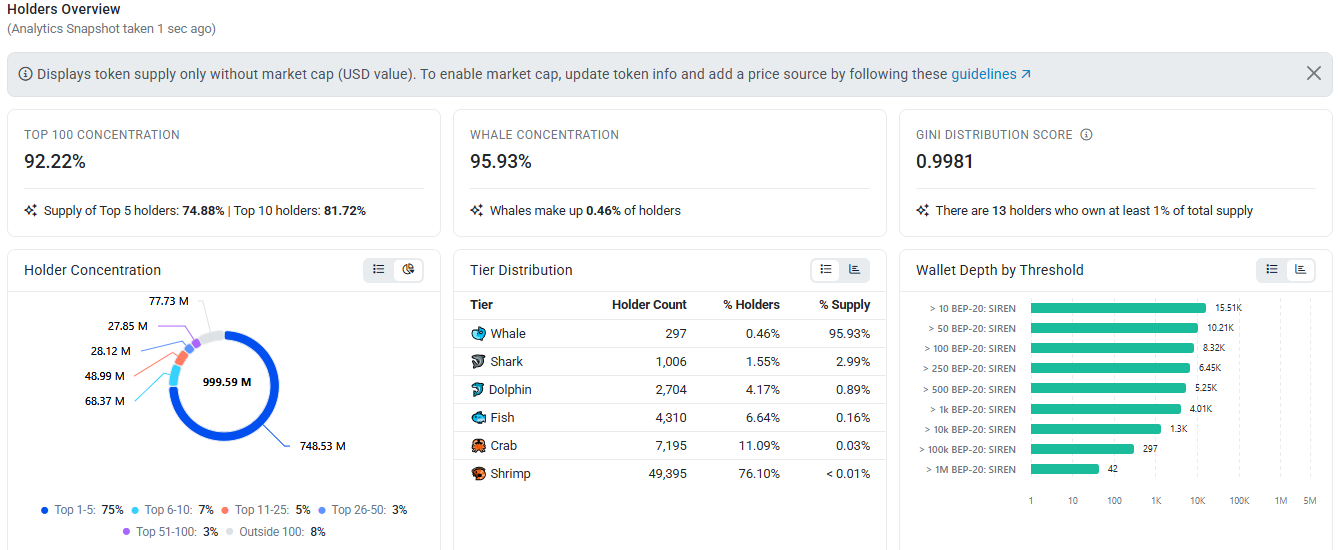
The Gini distribution score sits at 0.9981, reflecting extreme concentration, with only 13 holders owning at least 1% of total supply each.
By tier, 297 whale wallets hold 95.93% of supply, while the remaining roughly 69,000 holders across shark, dolphin, fish, crab, and shrimp tiers collectively hold under 4%.
This level of concentration means large holder movements could move price meaningfully in either direction, independent of broader market conditions.
Siren Liquidations and Exchange Volume
SIREN's liquidations have stayed light and mostly long-sided over the past 24 hours: $219.45 over 1h, $230.36 over 4h, $1.25K over 12h (almost entirely longs), and $5.43K over 24h, with longs accounting for $5.35K of that against just $88.32 in shorts. 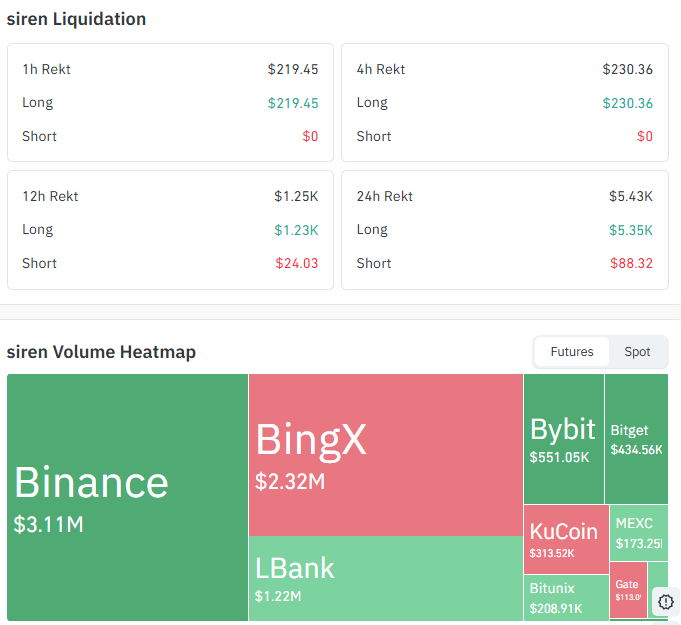
Source: Data From CoinGlass
This suggests recent long positions have been getting stopped out during the pullback rather than any large-scale short squeeze.
On the exchange side, Binance leads futures volume at $3.11M, followed by BingX at $2.32M and LBank at $1.22M, with smaller volumes spread across Bybit, Bitget, KuCoin, MEXC, Bitunix, and Gate.
SIREN Price Prediction Chart: Technical Analysis
Pair: $SIREN/USDT · Market: Perpetual (Crypto) · Exchange: KuCoin · Timeframe: 1D · Source: TradingView · Timestamp: August 4, 2026, 15:30 UTC+5:30
$SIREN is trading at $0.02728, after a steep decline through a descending channel that ran from mid-June into mid-July, taking the price from a high near $0.055 down to roughly $0.02611.
Price broke out of that channel in mid-July, rallying to touch $0.03249, and then pulled back into a tighter consolidation range between $0.02611 and $0.03249 that has held for the past two weeks.
The EMA (Exponential Moving Average, a momentum indicator that weights recent candles more heavily) picture is kept separate from this structure: the 20 EMA sits at $0.03203, close to current resistance, while the 50 EMA is still far above the current price at $0.11181.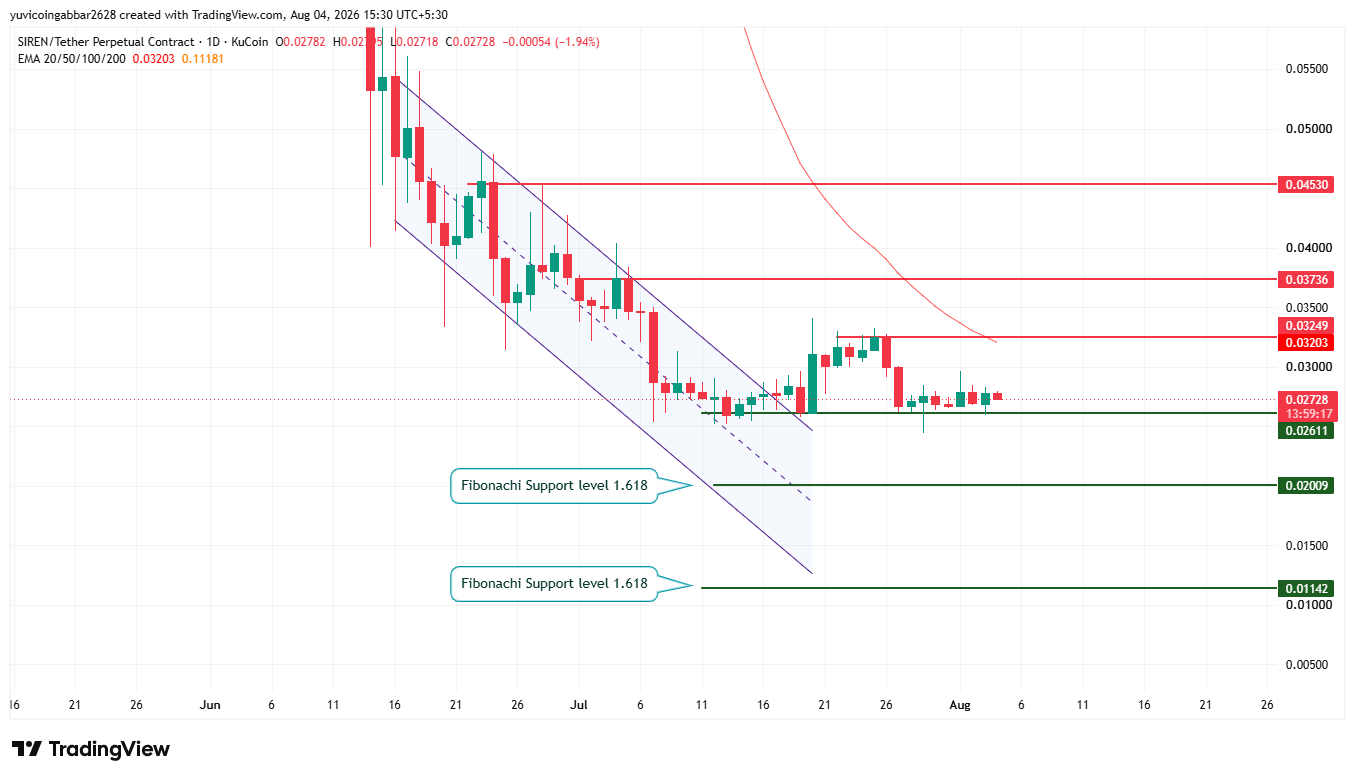
$SIREN price prediction: Support and Resistance Levels
Level Type | Price |
Resistance 3 | $0.04530 |
Resistance 2 | $0.03736 |
Resistance 1 (nearest) | $0.03249 |
Immediate Price Reference | $0.02728 |
First Support | $0.02611 |
Deeper Support (Fib 1.618 extension) | $0.02009 |
Structural Floor (Fib 1.618 extension) | $0.01142 |
SIREN price prediction: EMA Levels
EMA | Price |
EMA (shorter) | $0.03203 |
EMA (longer) | $0.11181 |
$Siren Forecast: Bull Case vs. Bear Case
$SIREN price target: 2026 Bull case: Holding above the first support at $0.02611 and clearing the nearest resistance at $0.03249 would suggest the consolidation is resolving higher.
A sustained move above $0.03249 would open the path toward $0.03736 and $0.04530.
$SIREN price target: 2026 Bear case: A break below $0.02611 would end the current consolidation range and put the mid-July channel breakout in question.
Losing that level would expose the Fibonacci 1.618 support at $0.02009, with $0.01142 as the deeper structural floor beyond that.
$SIREN price target: Can SIREN Reach $0.04530?
$0.04530 is the highest resistance level marked on the chart.
Reaching it would require $SIREN to first hold above $0.02611, clear the nearest resistance at $0.03249, and then break through $0.03736, a multi-stage move rather than a single leg.
What Could Invalidate the Bullish Setup?
A rejection at $0.03249 followed by a failure to hold $0.02611 would put the current consolidation range in question.
A deeper break below that level toward the Fibonacci 1.618 support at $0.02009 would undermine the recovery structure built since mid-July, with $0.01142 as the next level beyond that.
Siren Price Prediction 2026: Expert View
According to CoinGabbar analysts, the chart shows a token that has stabilized after a sharp decline, with the current $0.02611 to $0.03249 range acting as a genuine consolidation rather than continued distribution.
Liquidation data supports this reading, since the muted, long-skewed liquidations point to gradual repositioning rather than panic selling or an aggressive short squeeze.
The bigger factor to watch longer-term is the extreme holder concentration, with whales controlling nearly 96% of the supply.
In a market this concentrated, technical levels can break down quickly if a small number of large holders decide to move, so the $0.02611 support deserves closer attention than usual.
$Siren Price Prediction: Data Sources
Price and EMA data referenced from a 1D $SIREN/USDT perpetual chart via TradingView on KuCoin, timestamped August 4, 2026, 15:30 UTC+5:30.
Market cap, FDV, volume, and supply data referenced from CoinMarketCap. Holder concentration and distribution data referenced from on-chain analytics.
Liquidation and exchange volume data referenced from Coinglass.
Disclaimer: This piece is for informational purposes only and isn't financial advice. The levels and scenarios above are based on technical chart analysis and publicly available data at the time of writing, and crypto markets can move sharply within hours, so past patterns don't guarantee future outcomes. It's worth doing independent research and considering your own risk tolerance before acting on any of the levels discussed here.


















