Solana Gains 8.4M Weekly Addresses: What It Means for SOL Price


Solana price today
Solana (SOL) is trading near $76.29, up a small 0.3% over the past day, according to CoinGlass data.
The coin has had a rough few months. It's still far below the highs it touched earlier this year near $144.
Right now, SOL sits inside a narrowing price range. Traders are watching closely to see which way it breaks.
Why is Solana network growth rising?
New data from Ali Charts shows Solana added an average of 8.4 million new addresses per week recently.
That's the highest weekly growth this chart has tracked, based on Glassnode data. The number has climbed steadily since late June.
More addresses usually means more people are using the network. It doesn't always mean more price gains right away, but it's a healthy sign for adoption.
Growing address counts often show up before price moves, not after. So this trend is worth watching over the coming weeks.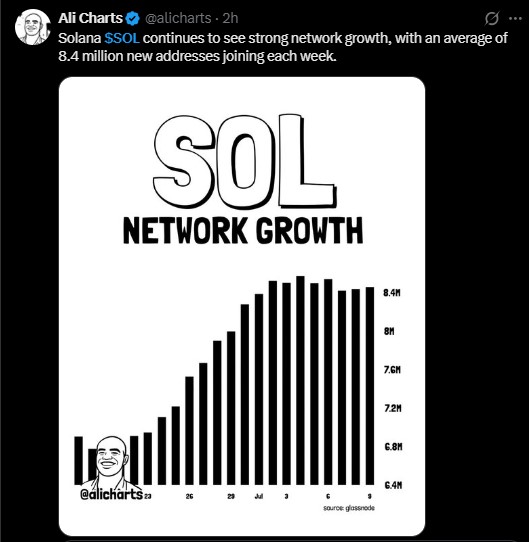
What does the SOL options market show?
Options data from a derivatives dashboard shows some interesting numbers for today's (July 13).
Metric | Value |
24h Put Volume | 16,000.00 |
24h Call Volume | 15,310.00 |
Put/Call Ratio | 1.05 |
Call Open Interest | 109.00 |
Put Open Interest | 197.00 |
Total Open Interest | 306.00 |
Notional Value | $233,637.12 |
Max Pain Price | $77.00 |
The put/call ratio of 1.81 (open interest basis) leans bearish. More traders are holding puts than calls.
The max pain price sits at $77, close to where SOL is trading now. This is the level where option sellers lose the least money.
Big open interest also shows up near the $76 and $78 to $79 strikes. This suggests traders expect price to stay in this zone short term.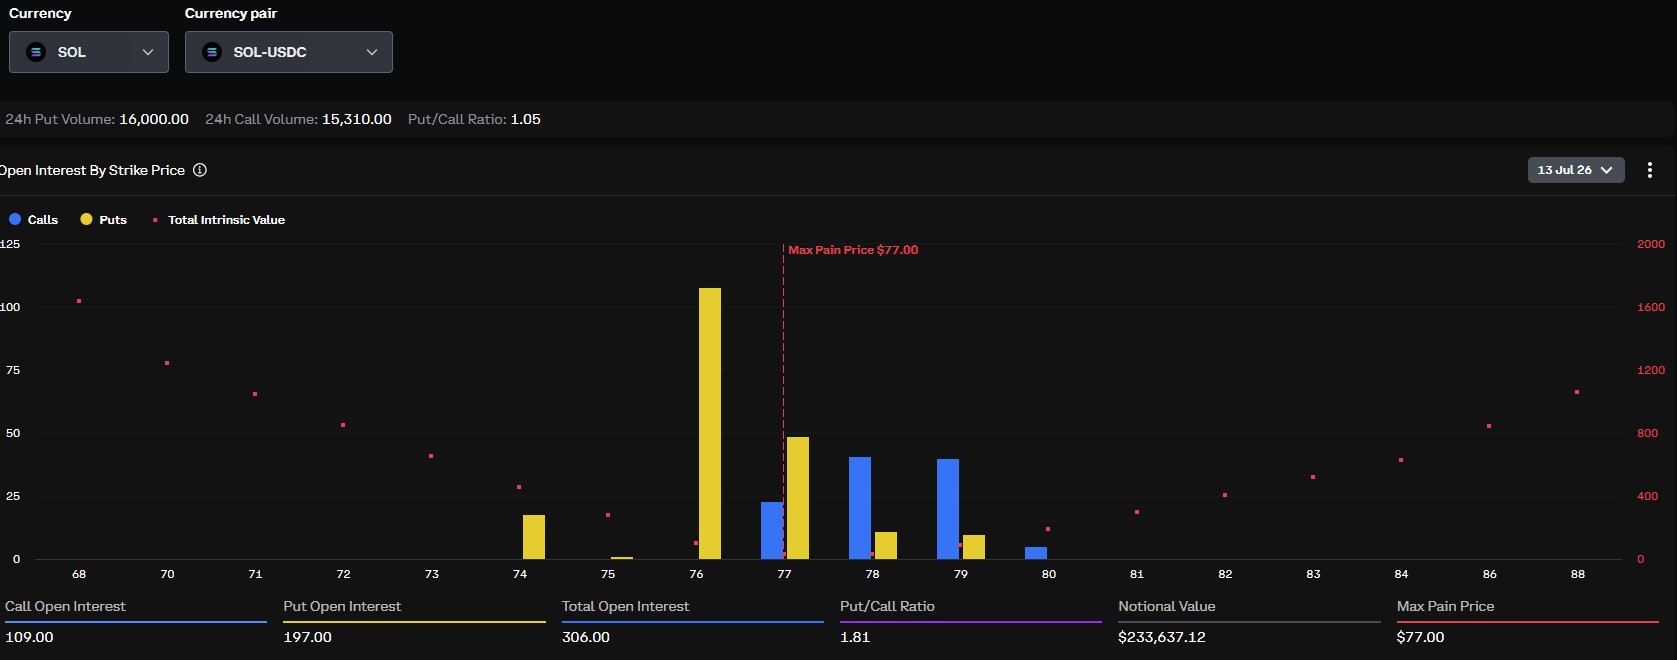
What do futures and derivatives data say?
CoinGlass futures data shows Solana's 24-hour trading volume at $5.15 billion, up 8.39%.
Open interest sits at $5.01 billion, up 1.41% over the same period. Options open interest is at $79.16 million.
The long/short ratio across accounts is close to even at 0.9912. On Binance, though, top traders show a long/short ratio of 1.4718, meaning more of them are leaning long.
Liquidations tell a mixed story. Over the past 24 hours, $6.21 million in positions were wiped out, with longs losing more ($3.62 million) than shorts ($2.59 million).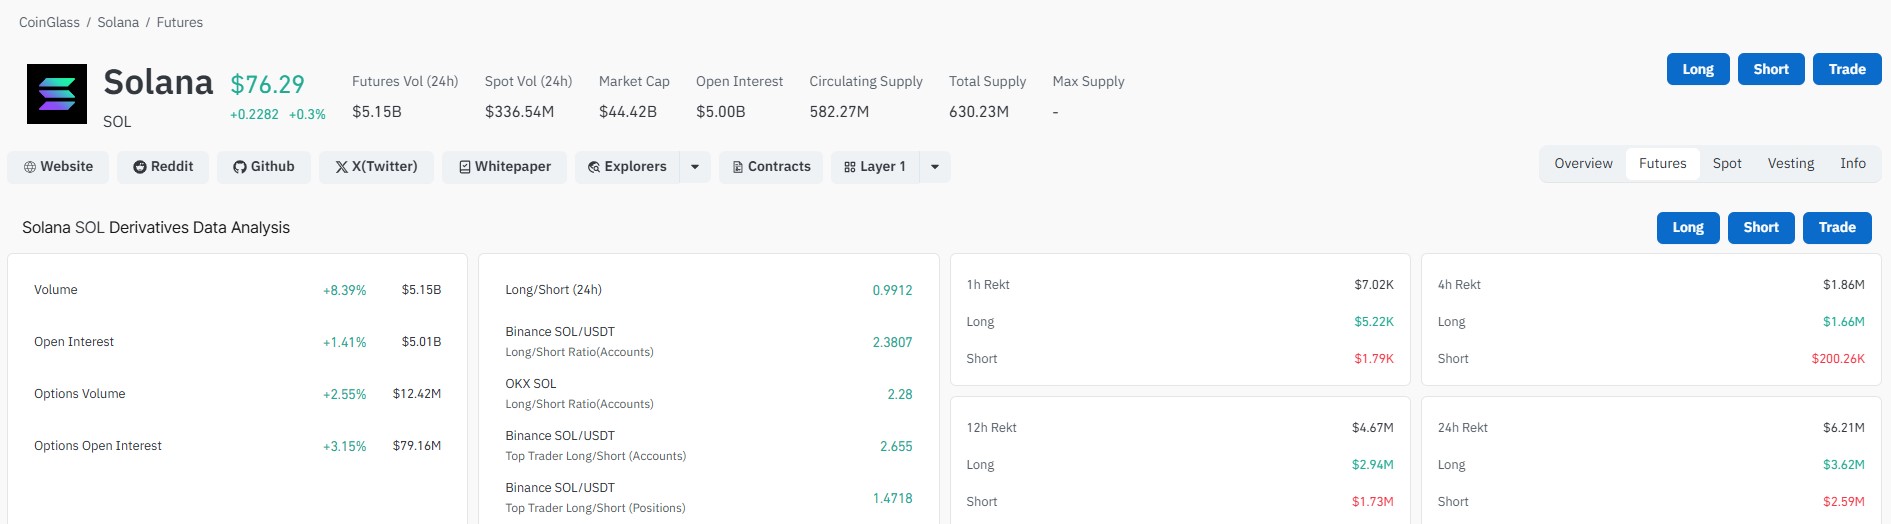
SOL/USDT technical chart analysis
As per technical analysis, on the daily chart, Solana is trading inside the rising channel pattern since February, based on Smart Money Concepts markings.
Price has been trading in a short-term rising channel since starting June. It's now trading around $76.31, down 0.78% on the day.
The RSI reads 49.84, sitting right in neutral territory. This means the market isn't clearly overbought or oversold.
Chart annotations point to two possible zones. A move higher could target the $84 to $88 area, roughly a 28% gain.
A drop could send price toward the $56 to $60 zone, also close to a 28% move.
Which path plays out likely depends on whether SOL holds support above the mid-$70s in the coming sessions.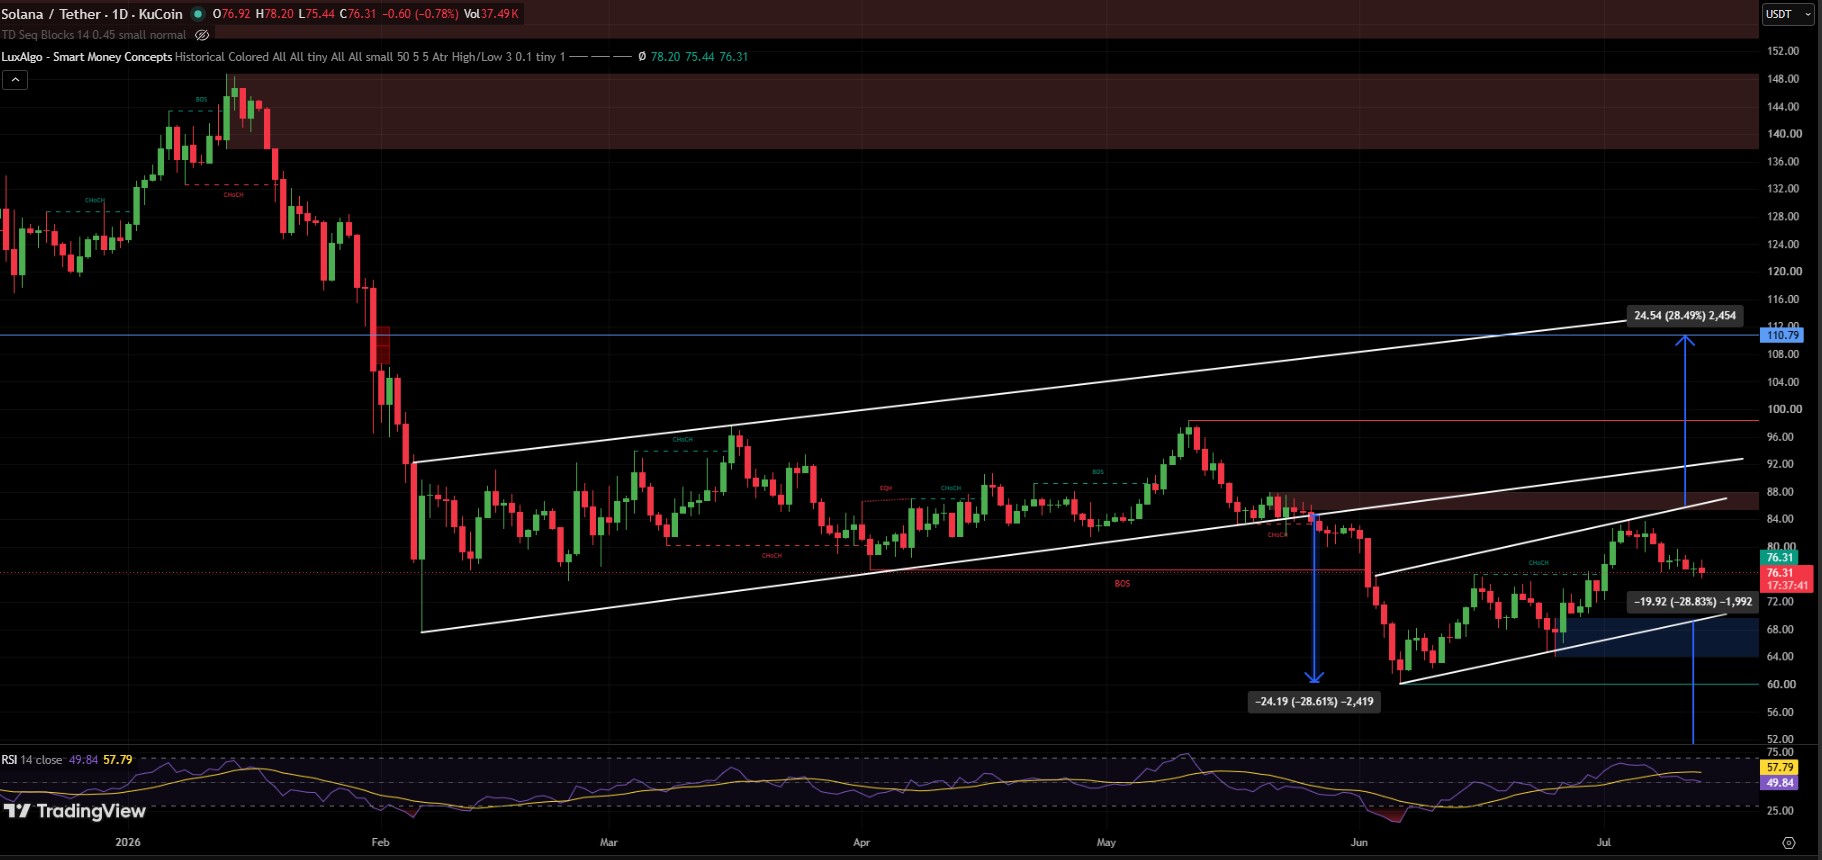
Is Solana a good investment right now?
Solana shows strong network growth, but options traders are leaning slightly cautious. The coin sits at a technical crossroad, with support and resistance levels close by.
Growth in addresses is a longer-term signal. Options and futures data reflect near-term trader positioning, which can shift fast.
Anyone watching SOL should track both angles together rather than relying on one alone.
Disclaimer
This article is for informational purposes only and should not be considered financial or investment advice. Cryptocurrency markets are highly volatile and carry significant risk. Always do your own research and consult a licensed financial advisor before making investment decisions. Past performance does not guarantee future results.

















