Solana Price Prediction: SOL Crashed 72%, Is $1000 Still Real?


Solana is down 72% from its all-time high, holding a critical Fibonacci support zone, as fresh ETF inflow data and a 45% surge in active developers signal the network is quietly building through the bear phase.
SOL was trading at $84.60 at press time, recovering from a February 6 low of $67.44 after collapsing from the January 2025 peak of $295.60.
The same monthly chart structure that called this crash in October 2025, when the crowd was screaming $1000, and nobody wanted a bearish word, is now printing the next setup.
The signal is cleaner than most people realize right now.
Nobody Heard the SOL Warning
In October 2025, when SOL was trading between $190 and $220, one technical call stood out against the noise. The monthly Fibonacci structure showed SOL was dangerously overextended.
A drop below $100 was not a bearish opinion. It was the higher probability outcome. The golden pocket accumulation zone between $60 and $35 was identified as the real destination.
The crowd ignored it. Social media kept running $1000 targets.
On February 6, 2026, SOL hit $67.44. That was a 73% collapse from the $259 range and a 77% decline from the January 2025 all-time high. Traders who leveraged long above $200 got wiped out completely, even at low leverage ratios.
Analysts tracking the monthly Fibonacci structure note that this mirrors Solana's 2022 behavior almost exactly, when SOL dropped 97% from its peak before staging the recovery that took it all the way to $295.60. The chart marks that 97% collapse as a direct reference point for the current cycle.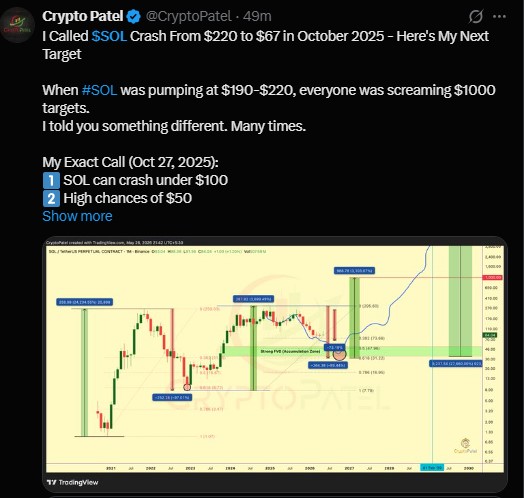
Where Solana Sits Now
SOL is currently sitting just above the 0.382 Fibonacci retracement level at $73.66. The price holding at $84 means buyers stepped in at the first major retracement zone after the collapse.
Below that, the monthly chart shows a Strong Fair Value Gap running from $47 down to $31. This is the accumulation zone where large buyers historically position before the next cycle begins. Two key Fibonacci levels sit inside this zone:
0.5 retracement at $47.96
0.618 golden pocket at $31.22
If Bitcoin faces another wave of selling or macro sentiment turns risk-off, SOL can still test these deeper zones. A drop to $32 would represent an 89% drawdown from the all-time high. That number sounds extreme. But by Solana's own historical standards, it is completely normal.
The structure is not broken. It is compressing.
SOL $1000 Is Still Valid
The long-term Fibonacci extension on the monthly chart maps a cycle target of $968.78. This is not a social media number. It is a direct projection from the 2020 cycle low to the 2025 cycle high using standard Fibonacci methodology, the same approach that correctly identified the crash target.
Analysts tracking this structure place the timeline for this target between late 2027 and early 2029. The path there follows a clear sequence:
A potential final flush toward the $50 to $32 golden pocket
A multi-month base-building phase with volume confirmation
A clean breakout above the previous all-time high of $295.60
A cycle extension toward $968 to $1000 at peak momentum
None of this happens in a straight line. But the structure that supports the $1000 thesis has not been invalidated. It has simply been reset to a more honest base.
Solana Network Keeps Building
While price has been bleeding, the Solana network has been doing the opposite.
Spot Solana ETFs posted their largest weekly inflows since February in mid-May 2026. Active developer counts grew 45% last quarter, giving Solana the highest share of active developers among all major Layer 1 blockchains at 23%.
Western Union is launching its USDPT payment product directly on Solana. Major financial institutions are moving billions in tokenized assets onto the network right now.
The Agave v4.0 upgrade, live on mainnet since May 2026, is cutting block confirmation times from 400 milliseconds to 200 milliseconds.
That doubles throughput capacity and makes Solana significantly more competitive for high-frequency financial applications going into the next cycle.
Infrastructure always precedes price in crypto. The network is not waiting for sentiment to catch up.
Watch These SOL Levels
Resistance at $96 is the current ceiling. A confirmed daily close above $87 is the minimum signal needed to validate any short-term recovery. A break below $79 reopens the path toward $67 and the deeper Fibonacci zones.
Institutional behavior is still cautious. Bank of America recently trimmed its Solana ETF exposure while increasing Bitcoin positions. Large players are in risk management mode, not accumulation mode, at these levels.
The $84 range represents a 71% discount from the all-time high. Gradual dollar-cost averaging here makes sense for long-term holders.
But based on the Fibonacci structure, the deepest and best risk-reward entry remains in the $50 to $32 zone if the market delivers one more leg down before the next cycle begins.
The next critical test comes when the June monthly candle closes and confirms whether the $84 support level holds or breaks. That single close will tell you everything about where the next three months go.
Patience built the last Solana fortunes. Hype destroyed the accounts that chased them.
This article is for informational purposes only and does not constitute financial or investment advice. Cryptocurrency markets are highly volatile. Always conduct your own research before making any investment decisions.
Also read:

















