SoSoValue Price Prediction: SOSO Breaks Out of a Falling Wedge


SoSoValue price prediction searches are climbing fast this week, and the chart explains why. After months of grinding lower inside a falling wedge, SOSO just posted a sharp double-digit rally that pushed price clean through a multi-month downtrend line on both the intraday and weekly timeframes.
Is this the start of a real trend reversal for SoSoValue, or another sharp bounce inside a longer downtrend that eventually fades? That is the question behind most current SOSO crypto price prediction searches right now, and it sits alongside the broader questions covered in our crypto price prediction hub. Here is what the chart structure, on-chain data, and recent catalysts actually show.
Key Takeaways
SOSO trades near $0.3432, up roughly 21.57% over 24 hours and nearly 19.67% for the week.
The 4-hour chart broke sharply higher out of a rectangular channel; RSI on that timeframe reads 85.84, deeply overbought.
The weekly chart shows a textbook falling wedge breakout, yet weekly RSI sits at only 43.69, still below the neutral 50 line.
Immediate 4-hour resistance sits at $0.3785, then $0.4052. Support sits near $0.3195, then $0.2792, then $0.2693.
Weekly resistance levels stack at $0.3715, $0.4528, and $0.5430. Weekly support sits at $0.2707, with a deeper floor at $0.2000.
Market cap sits near $117.38M, up 21.58%, with 24-hour volume of $5.69M, up 38.19%; a vol/market-cap ratio of 4.67%.
Liquidity relative to market cap is thin, at just 0.26%, which helps explain how sharply price can move on modest volume.
Holder concentration is extreme: the top 5 wallets alone control roughly 88% of supply, and the top 100 wallets control 99.98%.
Token Contract
Contract Address: 0x76A0e27618462bDAC7a29104bdcfFf4E6BFCea2D Standard: ERC-20 (18 decimals) Security Rating: CertiK 4.4 / 5
Where SOSO Stands Right Now
SOSO last traded around $0.3432, up about 21.57% over the past 24 hours, with the 24-hour range running from a low of $0.2814 to a high of $0.3492, a snapshot also visible on the live SoSoValue market page. Market cap sits at roughly $117.38M, also up 21.58% on the day, while fully diluted valuation (FDV) comes in far higher at $343.26M, a reminder of how much SOSO supply is still outside circulation.
Total and max supply are both fixed at 1,000,000,000 SOSO, with circulating supply at 342M SOSO, meaning just over a third of the total supply is currently in the market. On-chain data shows an implied on-chain market cap near $347.3M against a circulating-supply market cap closer to $118.95M, a gap that matters for anyone weighing where real float sits versus theoretical fully diluted value, a distinction we also unpack in our wider price prediction coverage.
The all-time high, $0.9476, was set back on October 28, 2025, roughly nine months ago. The current price sits about 63.13% below that peak. On the other end, the all-time low of $0.2671 was set just over a month ago, on June 15, 2026, and the price now trades more than 30.81% above that floor. In short, SOSO has already suffered a deep drawdown from its highs and is now bouncing off a fairly recent bottom rather than pushing toward new highs.
What Is Driving SOSO's Price Today
Unlike a pure liquidation-driven squeeze, this move lines up with fresh product news around the SoSoValue ecosystem. SoSoValue recently announced that its Tigris Protocol is now live on ValueChain, opening subscriptions for a new CXMT Vault designed to give users yield exposure to Asia's leading DRAM chipmaker directly on-chain. That kind of real-world-asset (RWA) tie-in tends to draw fresh speculative attention into the associated token.
Adding to the momentum, SoDEX has been promoting a trading tournament with $100,000 in claimable rewards and has directly tied CXMT research participation to $SOSO, encouraging holders to use the token to vote on upcoming RWA opportunities ahead of CXMT's expected public listing. That combination of a live product launch, an active claim window, and direct token utility around a headline-grabbing IPO story appears to be the primary driver behind today's volume spike, rather than any single exchange listing, a pattern worth comparing against the flows described in our latest crypto news coverage.
Technical Analysis: 4-Hour Chart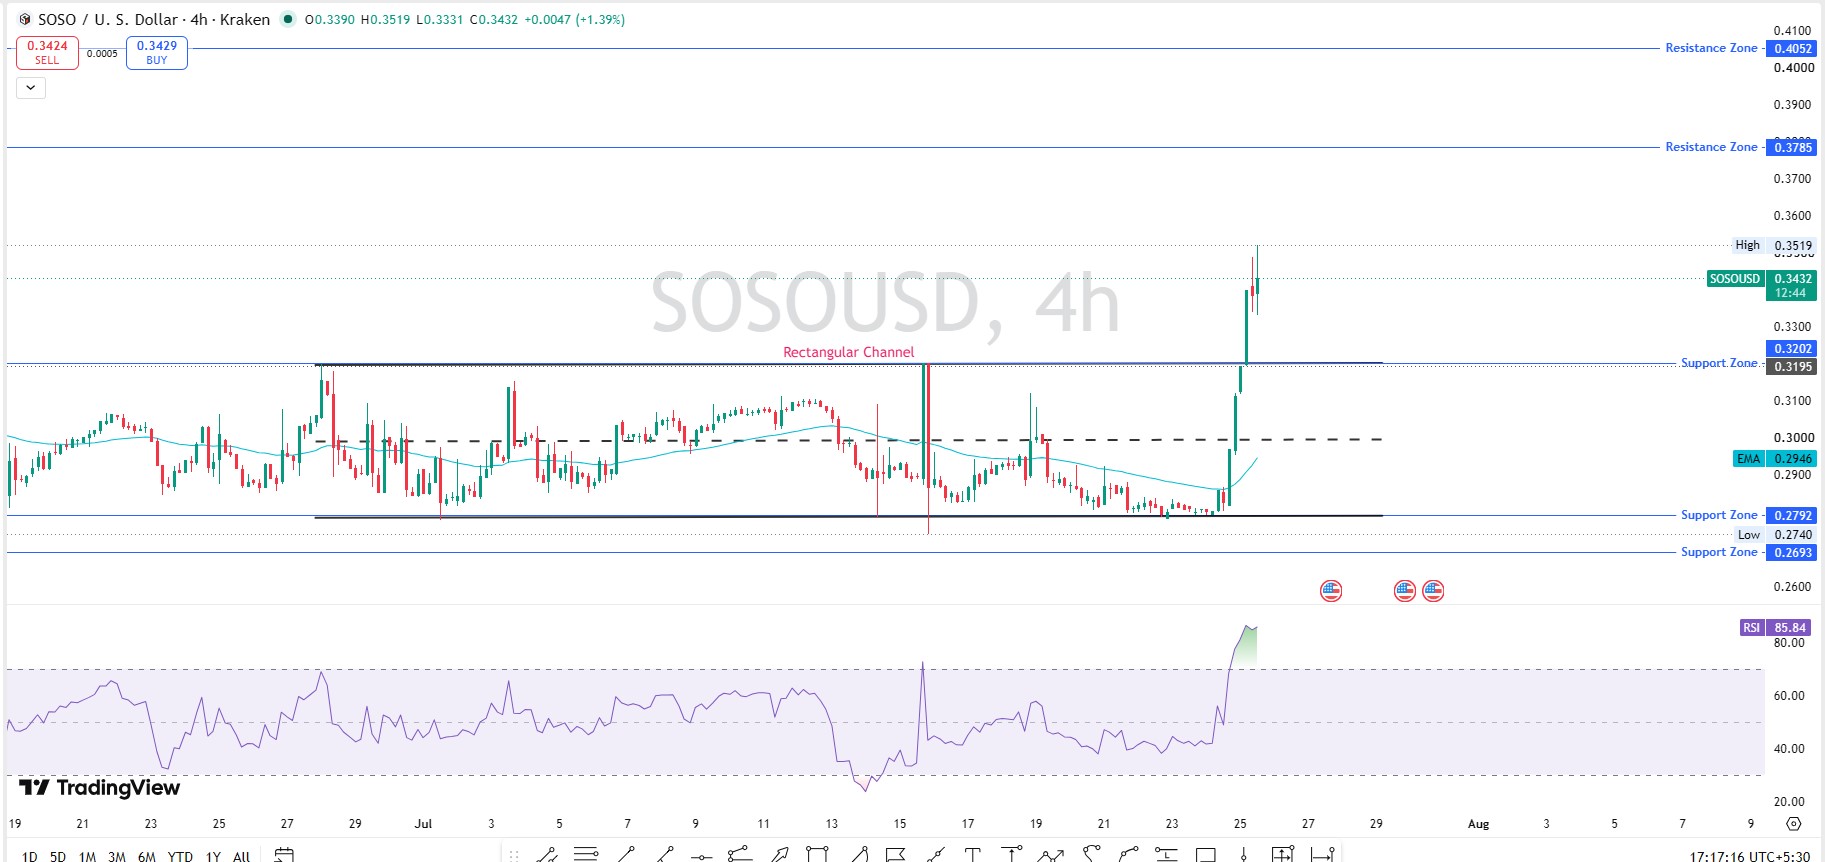
On the 4-hour SOSO/USD chart, price spent weeks compressing inside a rectangular channel between roughly $0.2792 and $0.3195 before a single sharp candle broke out to a high of $0.3519, eventually settling near $0.3432, a structure visible on TradingView's live charting tools. That breakout candle alone represented a move of well over 10%.
RSI on this timeframe reads 85.84, deep into overbought territory. The EMA sits at $0.2946, far below the current price, confirming the short-term trend has turned decisively bullish but also underlining how stretched this move already is after such a fast advance.
Resistance sits first at $0.3785, with a heavier zone at $0.4052 above that. Support underneath sits at $0.3195, backed by a zone at $0.2792 and a deeper floor at $0.2693.
Support and Resistance Snapshot (4H)
Level | Price |
Resistance 2 | $0.4052 |
Resistance 1 | $0.3785 |
Current Price | $0.3432 |
Support 1 | $0.3195 |
Support 2 | $0.2792 |
Support 3 | $0.2693 |
Technical Analysis: Weekly Chart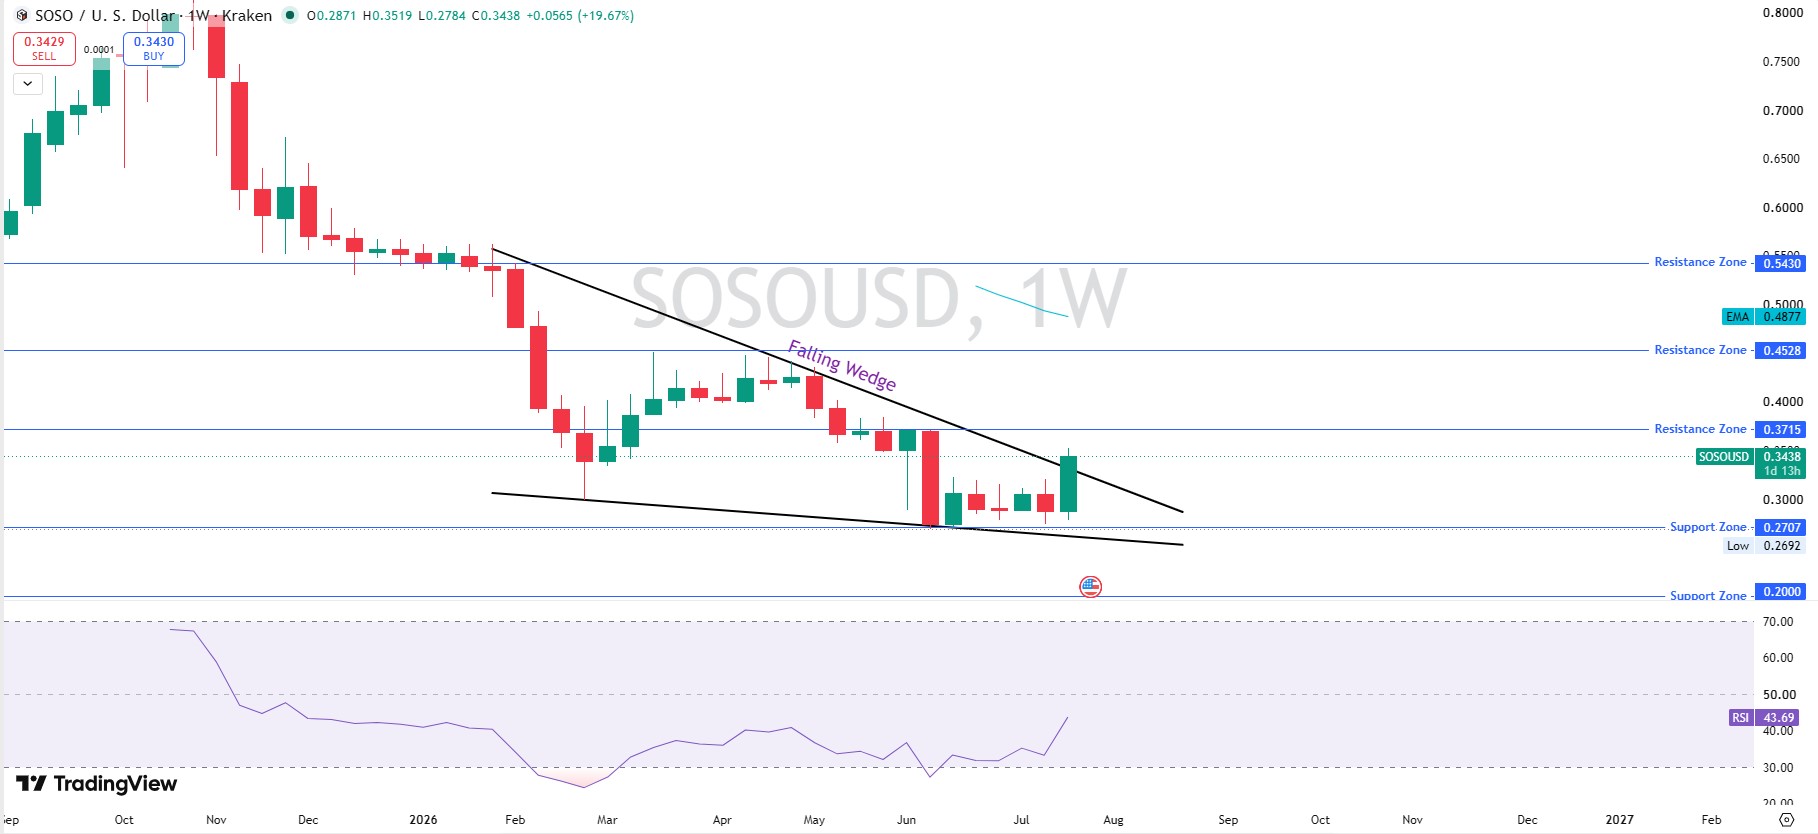
Zoom out to the weekly SOSO/USD chart, and the picture is a genuine pattern break. Price has been carving out a falling wedge since the start of the year, a structure generally read as a bullish reversal setup when it resolves to the upside, not unlike the wedge and channel patterns tracked in our Bitcoin price prediction 2026 coverage. This week's candle opened near $0.2871 and is closing around $0.3438, up nearly 19.67% for the week, pressing right against the upper wedge trendline.
Weekly RSI reads 43.69, still below the 50 midline. That is the key tension in this chart: a large weekly gain that has not yet flipped weekly momentum bullish by RSI's own measure. That leaves room to run if buyers keep showing up, but it also signals this breakout is still fresh and unconfirmed on the higher timeframe.
Above price, resistance stacks at $0.3715, then $0.4528, then $0.5430. Support below sits at $0.2707, with a much deeper floor near $0.2000 should the broader downtrend reassert itself.
Support and Resistance Snapshot (Weekly)
Level | Price |
Resistance 3 | $0.5430 |
Resistance 2 | $0.4528 |
Resistance 1 | $0.3715 |
Current Price | $0.3438 |
Support 1 | $0.2707 |
Support 2 | $0.2000 |
Tokenomics and Holder Concentration
SOSO's contract is a standard ERC-20 token rated 4.4 out of 5 by CertiK, with full supply and holder data available on Etherscan's token page. Total and max supply are fixed at 1,000,000,000 SOSO, with 342M SOSO circulating, leaving a substantial unlock overhang of roughly two-thirds of the total supply is still outside the market.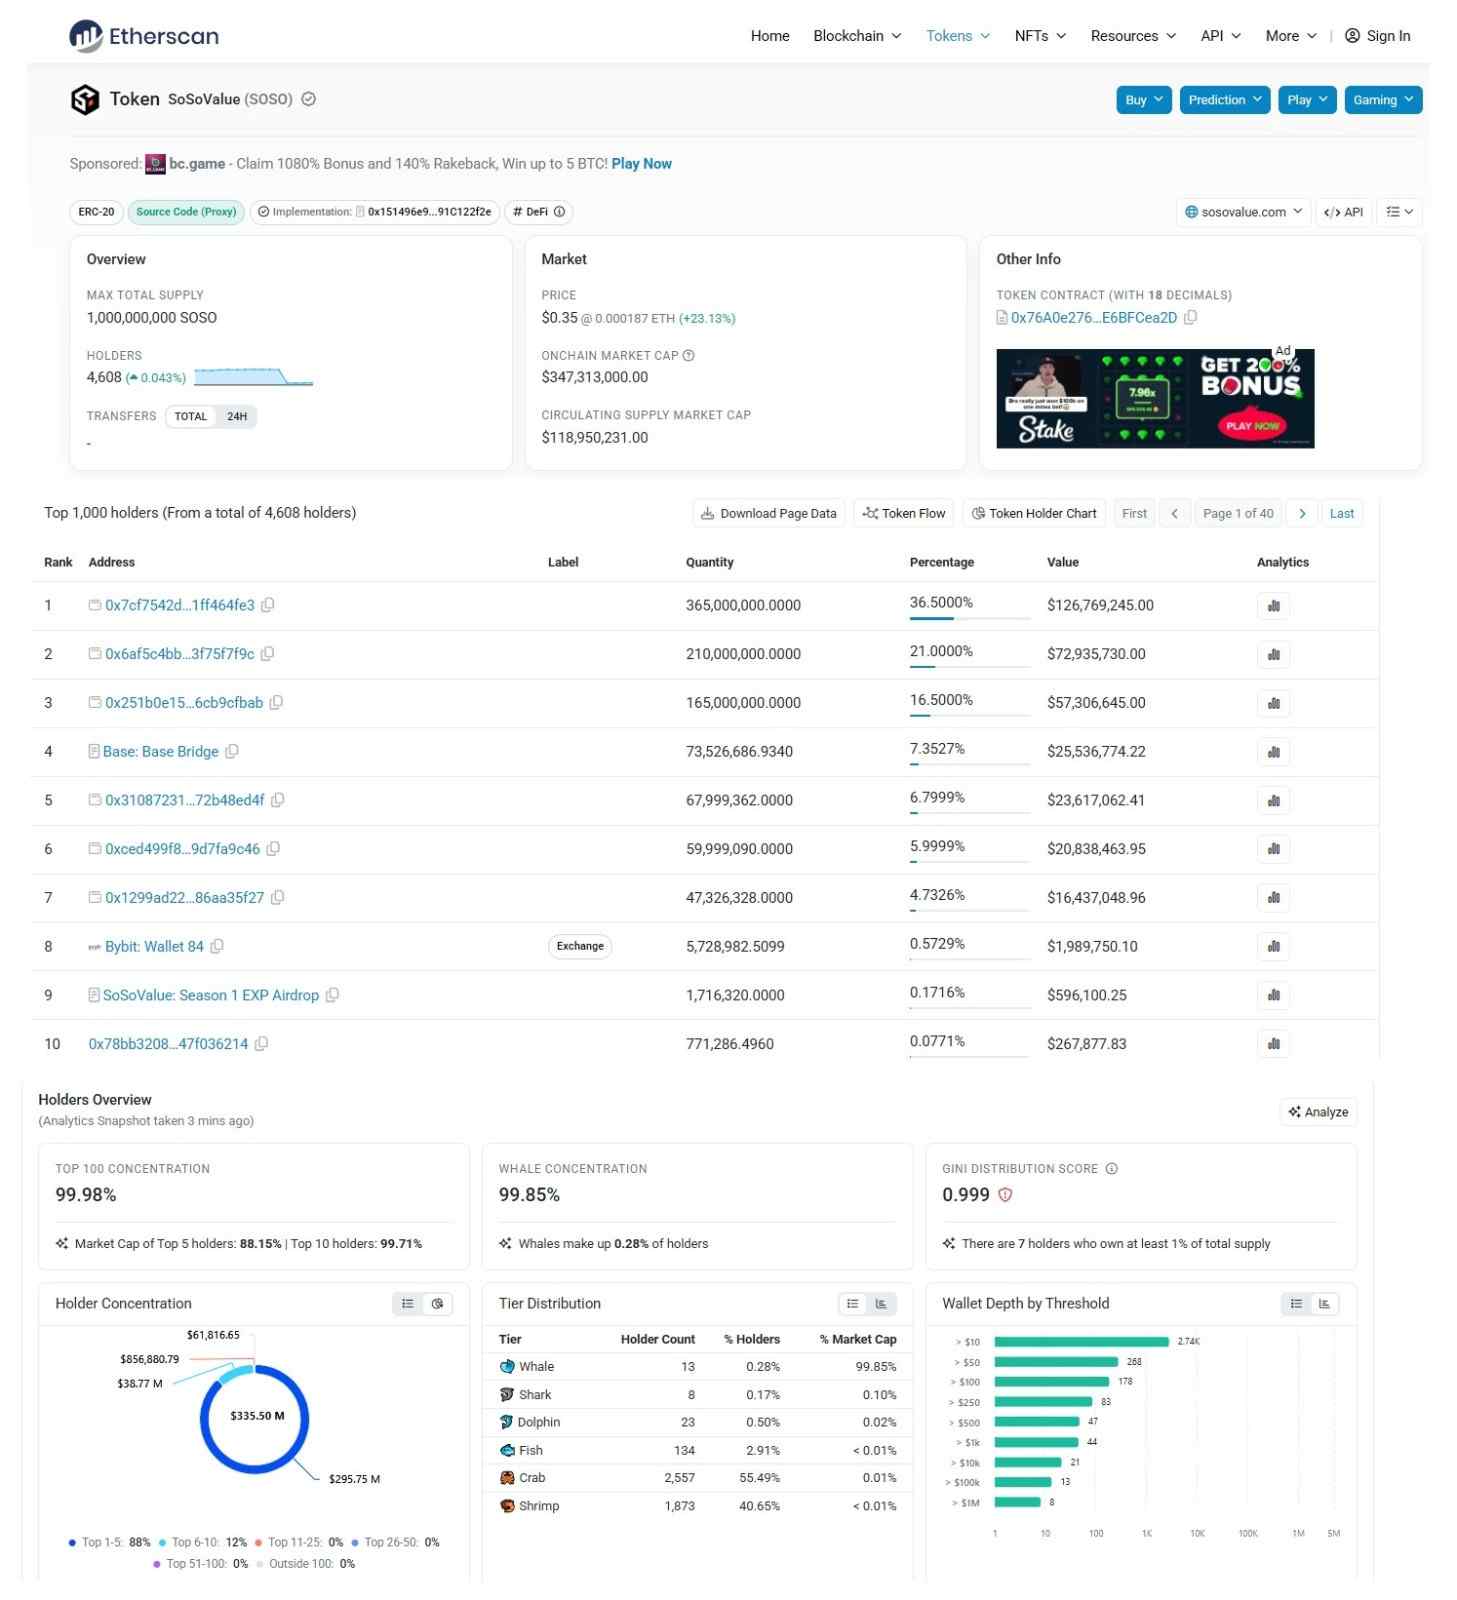
Holder concentration is severe. The top 100 wallets control 99.98% of the tracked supply, and just 13 whale wallets, only 0.28% of the holder base, control 99.85% of the market cap. The Gini distribution score sits at 0.999, close to maximum inequality, and seven holders each own at least 1% of total supply.
Breaking down the top ten addresses: the single largest unlabeled wallet holds 36.50%, followed by a second unlabeled wallet at 21.00% and a third at 16.50%. The Base network's official bridge contract holds 7.35%, and two more unlabeled wallets hold 6.80% and 6.00%, respectively. Further down, a Bybit exchange wallet holds 0.57%, and the SoSoValue Season 1 EXP Airdrop contract holds 0.17%. Together, the top five addresses control roughly 88% of supply, and the top ten control 99.71%.
Holder Count Caveat: Total holder counts differ meaningfully by source, with Etherscan showing 4,608 addresses against a much higher figure of 93.63K listed elsewhere. Anyone sizing a position should verify holder data independently before treating either number as definitive.
Liquidity and Volume
Liquidity relative to market cap is thin at just 0.26%, well below levels typically seen as healthy for a token of this size. Twenty-four-hour volume came in at $5.69M, up 38.19%, producing a vol/market-cap ratio of 4.67%, which points to genuinely elevated turnover rather than a quiet drift higher, a dynamic worth weighing against the turnover patterns in our Ethereum price prediction 2026 analysis.
That combination, thin liquidity paired with a sudden volume spike tied to product news; helps explain why SOSO moved so sharply in such a short window. Thin order books tend to amplify both the upside and the eventual pullback once early buyers begin taking profit.
Bull, Base, and Bear Scenarios
None of this is financial advice. These are scenario-based estimates built from current chart structure, not guarantees, and should be read alongside broader crypto market conditions, including the sector-wide moves tracked in our Bitcoin coverage.
Bull Case: A 4-hour close above $0.3785 opens a path toward $0.4052 within 7 to 14 days, with the weekly falling wedge breakout confirming if weekly RSI pushes above 50. Probability is roughly 30%. Invalidation: a daily close back below $0.31.
Base Case: Price consolidates between roughly $0.28 and $0.38 over the next 7 to 30 days as the initial breakout momentum cools and the market digests the CXMT-related news flow. The probability is highest, roughly 45%. Invalidation: a clean weekly close outside either boundary.
Bear Case: Momentum fades and price retraces toward the $0.2693 support zone, with a deeper test of the $0.2000 weekly support possible within 30 days if broader sentiment cools or the wedge breakout fails to hold. Probability is roughly 25%. Invalidation: sustained volume holding above $0.35 for more than a week.
Price Forecast Table
Timeframe | Bear | Base | Bull |
24H | $0.31 | $0.34 | $0.37 |
7D | $0.26 | $0.33 | $0.40 |
30D | $0.20 | $0.35 | $0.50 |
Long Term | $0.15 | $0.45 | $0.95 |
These figures are not predictions of certainty. They are ranges built around the support and resistance levels already visible on the chart, and any SoSoValue price prediction for 2026 should be treated as a scenario range rather than a guaranteed outcome.
Key Risks
Extreme short-term overbought conditions top the list, with 4-hour RSI near 86 leaving little room before a cooling-off period. A large supply overhang remains, with roughly two-thirds of total supply still outside circulation, which could pressure prices as future unlocks enter the market.
Holder concentration is severe, with a Gini score of 0.999 pointing to an extremely thin real float once the top handful of wallets is excluded. Liquidity relative to market cap is also thin at 0.26%, meaning both rallies and pullbacks can happen faster and harder than on more liquid tokens.
Distance from the all-time high, still down more than 63%, is a reminder that the longer-term trend remains a deep drawdown that has not yet been reversed. As with any SOSO token price prediction, sector-wide swings in crypto can override token-specific setups entirely, so this chart should be read alongside our broader crypto news rather than in isolation.
Glossary
RSI: A 0–100 momentum indicator. Above 70 typically signals overbought; below 30 signals oversold.
EMA: A trend-following average that weights recent prices more heavily than older ones.
FDV: What the market cap would be if every token that will ever exist were already circulating.
Gini Score: A measure of distribution inequality, from 0 to 1.
Falling Wedge: A chart pattern where price compresses between two converging downward-sloping trendlines, generally read as a bullish reversal setup when it breaks upward.
Invalidation Level: The price point at which a trading thesis is considered wrong and should be abandoned.
Disclaimer: This article is for informational purposes only and does not constitute financial advice. Cryptocurrency markets are highly volatile. Always do your own research and consult a licensed financial advisor before making investment decisions.

















