UBIK Price Prediction 2027-2030: Can UBIK Reach $0.10?


UBIK is up over 64% in a day after fresh exchange listings on LBank and MEXC. This UBIK price prediction breaks down the live price, RSI, MACD, key support and resistance levels, and 7-day, 30-day, and 2026 to 2030 forecasts. Can UBIK reclaim its $0.0309 all-time high, or does this fresh rally fade out before it even gets there?
Quick Prediction Box
Metric | Snapshot (Sep 9, 2026, 12:00 UTC) |
Current Price | $0.02895 - $0.02913 |
Trend | Bullish, but stretched |
Next Resistance (R1) | $0.03089 (ATH) |
Major Resistance | $0.03351 (Fib 1.0) |
Support (S1) | $0.02092 (EMA 20) |
Major Support (S2) | $0.01536 (24H low) |
RSI (14) | 64.98 |
Bull Case | $0.05069 |
Base Case | $0.025 - $0.029 |
Bear Case | $0.01536 |
Invalidation | Break below $0.01972 |
UBIK Price Prediction Today and Key Market Levels
UBIK trades near $0.02895 to $0.02913, up close to 65% on the day. The 24-hour range runs from $0.01536 to $0.02979, nearly a double top to bottom.
Market cap sits near $29 million. Circulating and total supply both sit at 1 billion tokens, so there's no hidden unlock waiting.
Volume over 24 hours ranges between $2.1M and $6.67M across sources. That spread says liquidity is thin.
The all-time high of $0.03089 came on Sep 7, 2026. The all-time low, $0.005951, was just two days earlier, on Sep 5, 2026. This coin's entire history fits inside one week.
Why Is UBIK Price Moving So Sharply Today?
This isn't slow drift. It's launch momentum, and it's loud.
UBIK is a community-driven meme token on the Robinhood Chain, tied to the Pons ecosystem. Listings arrived fast after launch.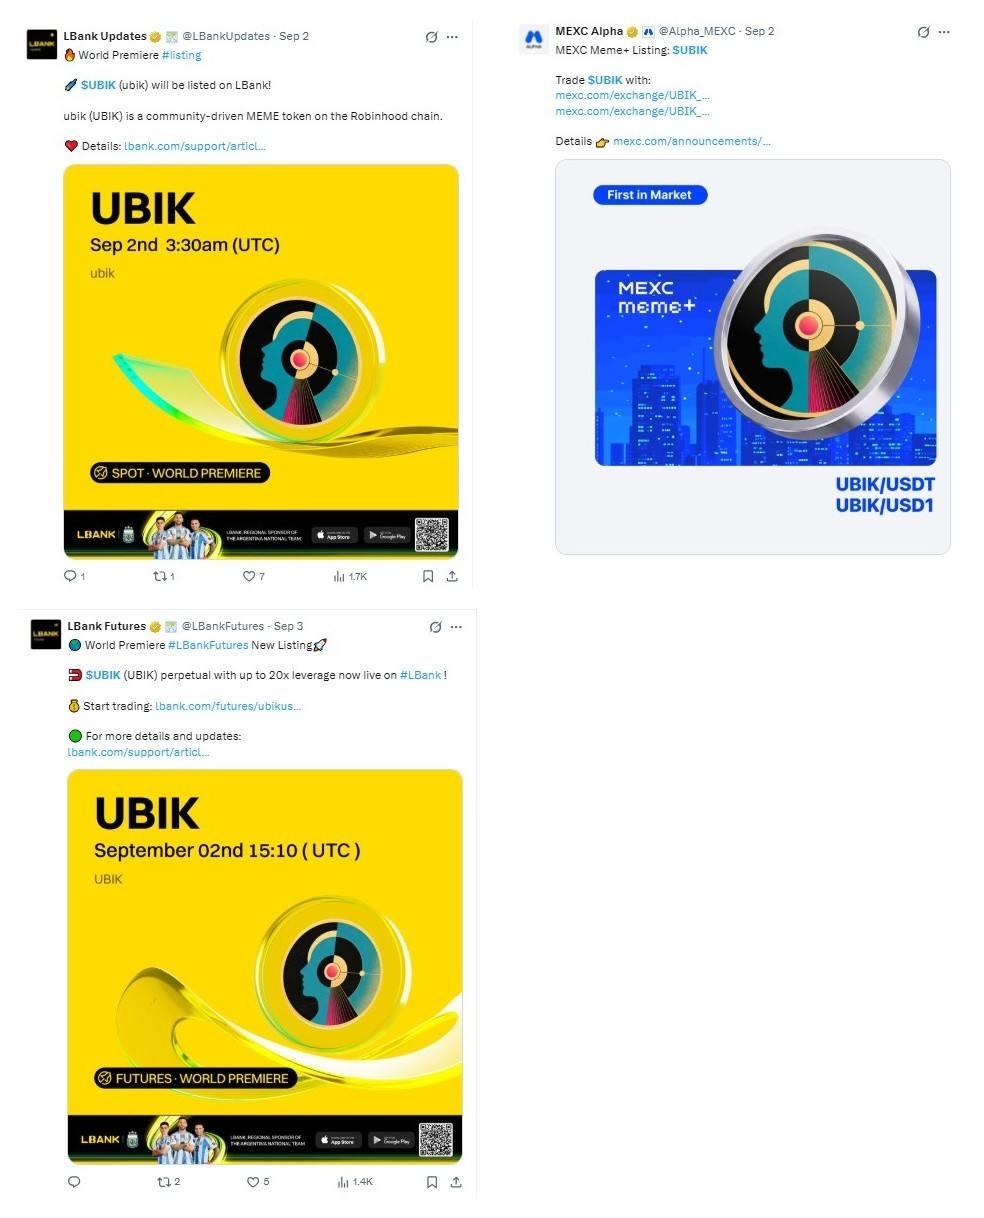
As per LBank, spot trading opened on Sep 2, 2026, at 3:30 AM UTC. Futures with up to 20x leverage followed on Sep 3, 2026, 15:10 UTC. As per MEXC, UBIK under its Meme+ program around the same window, against USDT and USD1.
Three listings in roughly a day. Few tokens see that in week one, and checking an exchange listing tracker shows how unusual that pace really is.
New listings pull in buyers fast. But they can pull liquidity out just as fast once the hype cools.
UBIK Technical Analysis and Current Trend
The 4-hour chart on Uniswap V4 (Robinhood) shows sideways grinding, then a sharp breakout.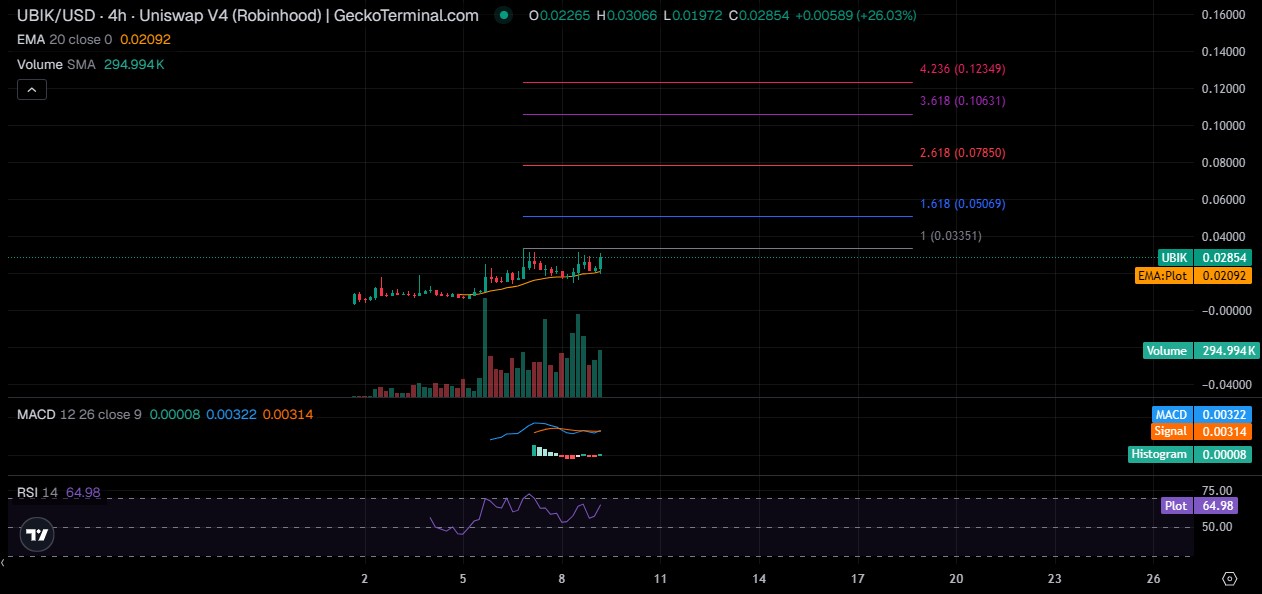
UBIK RSI and Momentum
RSI (Relative Strength Index, a 0-100 momentum gauge) reads 64.98. Bullish, not yet overbought.
When we checked the RSI history, the climb looked steady, not spiky. That's a healthier build than a straight vertical line would suggest. Room to run still exists. Not unlimited room, though.
UBIK Moving Averages and Trend
EMA 20 (20-period exponential moving average) sits at $0.02092. Trading holds well above it, keeping the short-term trend tilted up.
That gap runs close to 38%. Gaps this wide tend to close, either through a pullback or through the average catching up.
UBIK MACD Signal
MACD reads 0.00322, with the signal line at 0.00314. The histogram, just 0.00008, is thin.
Momentum's intact but fading a touch versus a few candles back. Turns out, the strongest push may already be behind this leg.
UBIK Volume and Breakout Confirmation
Volume SMA sits at 294.994K on the 4H chart. Breakout candles ran well above that.
Strong volume on the push past $0.02 adds credibility, but recent bars are tapering. Worth watching.
UBIK Support and Resistance Levels to Watch
Immediate UBIK Resistance
The nearest resistance is the ATH at $0.03089, set Sep 7, 2026. One test already failed here.
Major UBIK Resistance Near Recent ATH
Beyond that, Fibonacci extensions mark $0.05069, $0.07850, and $0.10631 as stretch zones, not near-term targets.
UBIK Support if the Rally Fails
EMA 20 at $0.02092 is the first cushion. Below that, the 24-hour low of $0.01536 is the next line. Losing it undoes most of this week's gains.
UBIK Price Prediction for the Next 7 Days
Bullish: A breakout past $0.03089 with strong volume opens $0.035 to $0.038.
Base case: Consolidation between $0.024 and $0.030.
Bearish: A failed retest, fading volume, and a slide back to $0.018 to $0.020.
We'd lean toward the base case. That thinning MACD histogram is a real, if small, warning sign. For context on how other coins are shaping up this week, the full price prediction hub is worth a look.
UBIK Price Prediction for the Next 30 Days
Scenario | Price Area | Condition |
Bullish | $0.040 - $0.051 | ATH breakout, volume holds |
Base | $0.020 - $0.032 | Sideways, listings absorbed |
Bearish | $0.008 - $0.015 | Support breaks, liquidity thins |
Thirty days is a long stretch for a meme token barely two weeks old. That's why the range stays wide.
UBIK Price Prediction 2026
Through the rest of 2026, everything depends on continued exchange momentum and growth across the Robinhood Chain. Deeper liquidity past today's $400K range could support a move toward $0.05 to $0.08.
If interest cools, as it often does post-listing, price could settle into a $0.01 to $0.02 range and stay there for a while. Tracking a crypto events calendar can help spot the next catalyst before it hits the chart.
UBIK Price Prediction 2027 to 2030
A precise 2030 price for a one-week-old token is guesswork dressed as analysis. Nobody can calculate that accurately, and anyone claiming otherwise is selling something. Still, scenario ranges give a rough sense of what different outcomes would actually require.
Year | Bear Case | Base Case | Bull Case |
2027 | $0.005 - $0.02 | $0.03 - $0.07 | $0.15 - $0.30 |
2028 | Below $0.01 | $0.02 - $0.06 | $0.20 - $0.40 |
2029 | Below $0.005 | $0.02 - $0.05 | $0.25 - $0.50 |
2030 | Near zero | $0.01 - $0.05 | $0.30 - $0.60 |
Here's the math behind those numbers. Market cap equals token price multiplied by circulating supply. UBIK's supply is fixed at 1 billion tokens, so every target converts into a specific dollar figure.
Hitting $0.05 requires 0.05 × 1,000,000,000 = $50,000,000 market cap. A bull case of $0.30 by 2027 means 0.30 × 1,000,000,000 = $300,000,000, roughly ten times today's size. The extreme bull case of $0.60 by 2030 works out to $600,000,000, a different league entirely for a meme token.
"Near zero" by 2030 in the bear case reflects what happens once liquidity dries up and volume disappears. That's the honest range, not a comforting one.
What matters longer-term: real adoption inside the Pons ecosystem, market cap growing alongside liquidity, and whether meme-cycle conditions stay favorable through 2030. Line those up, and growth follows. Miss them, and UBIK fades like most meme tokens eventually do, the way plenty of coins covered in AI crypto updates have faded once their own hype cycle passed.
Can UBIK Reach $0.05 or $0.10?
Supply is fixed at 1 billion tokens, so targets map directly to market cap.
Target | Required Market Cap |
$0.03 | $30M |
$0.05 | $50M |
$0.10 | $100M |
$0.25 | $250M |
$1.00 | $1B |
$0.05 needs roughly a doubled market cap. Hyped meme tokens have done that in days before and failed far more often, as recent memecoin news keeps showing. But $0.10 needs $100M and sustained real demand, not just launch-week noise.
UBIK Bull Case, Base Case, and Bear Case
Bull Case: Breaks $0.03089 on strong volume, more listings land, narrative holds. Target near $0.05.
Base Case: Spike cools, trading ranges $0.02 to $0.03 while the market finds fair value.
Bear Case: Momentum fades, early buyers exit, and liquidity dries faster than demand arrives. Target back toward $0.015 or lower.
That's the range. And you should pick a side based on your own risk tolerance, not hope.
What Could Invalidate the UBIK Bullish Setup?
Break and hold below EMA 20 at $0.02092
Volume collapsing under the 294.994K SMA repeatedly
A lower high before the ATH gets retested
Liquidity dropping meaningfully from today's $400K
A broader Bitcoin risk-off move
Large wallets distributing into strength
One alone isn't fatal. Two or three together would be.
UBIK Risks Traders Should Know
Micro-cap volatility is real at a $29M market cap. Books this thin swing 20% in an hour.
Liquidity risk and slippage (the gap between expected and actual trade price) both matter here, since deep order books don't fully exist yet.
And contract risk, meme-token risk, and narrative dependency all apply here, since UBIK leans on the Robinhood brand more than independent utility.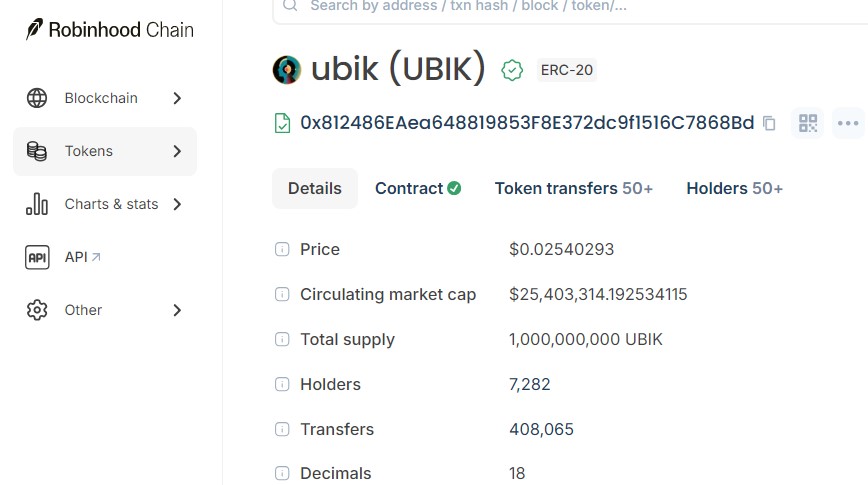
Whale concentration is worth watching too. With 7,282 holders and a billion-token supply, a handful of large wallets can still move price. And sharp drawdowns after sharp pumps are the norm here, not the exception. Traders chasing the next early entry instead might find better odds browsing active airdrop listings than gambling on a token already up 65% in a day.
Disclaimer
This article is for informational purposes only and doesn't constitute financial, investment, or trading advice. UBIK is a newly launched, low-liquidity meme token, and prices can swing hard. Always do your own research and talk to a qualified financial advisor before investing.

















