VELVET Price Prediction: Is History About to Repeat?

VELVET has broken out of a months-long consolidation, and the shape of the move looks familiar.
This VELVET Price Prediction looks at why the chart echoes an earlier expansion phase and what would need to hold up for that comparison to matter.
Why Is VELVET Moving Higher?
Price has jumped roughly 43% over the past 24 hours to near $0.9642, with trading volume climbing about 88% over the same window.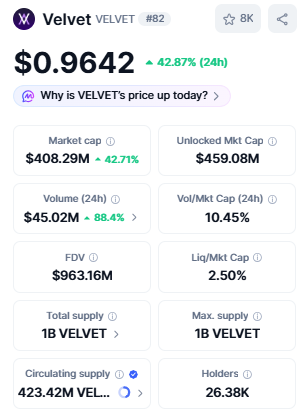
That kind of volume expansion points to significantly stronger participation, though it does not by itself confirm accumulation or guarantee continuation.
Market cap has risen in step to roughly $408.29M, while a volume-to-market-cap ratio near 10.45% reflects an unusually active session relative to its size.
Data source: CoinMarketCap
What Are VELVET Derivatives Traders Showing?
Open interest reached roughly $39.86M at the August 14 CoinGlass snapshot, expanding sharply from its recent baseline as price pushed higher.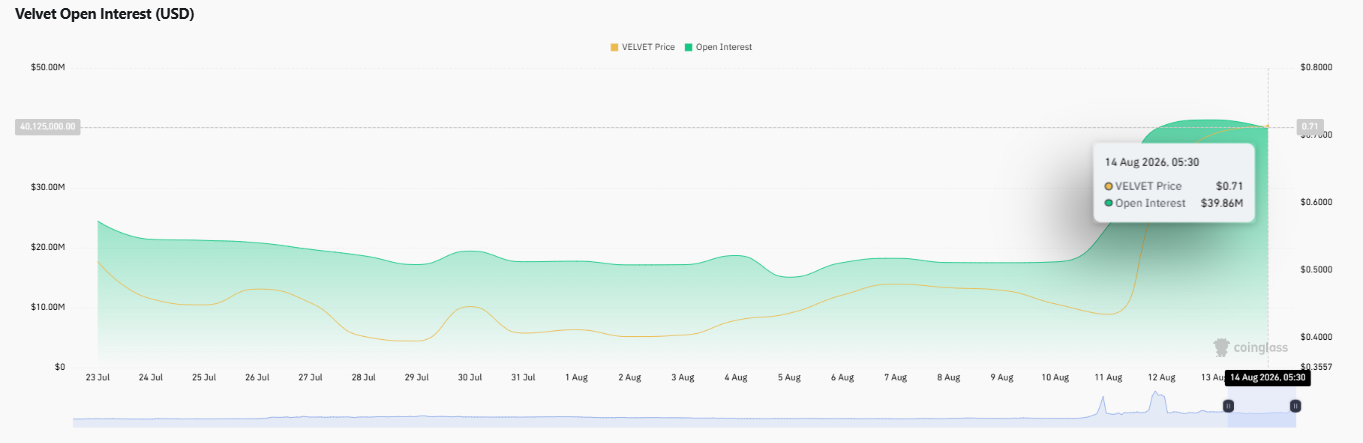
That growth signals more leveraged capital entering the market, but rising open interest on its own says nothing about direction, and it raises the odds of sharper swings if positioning starts to unwind.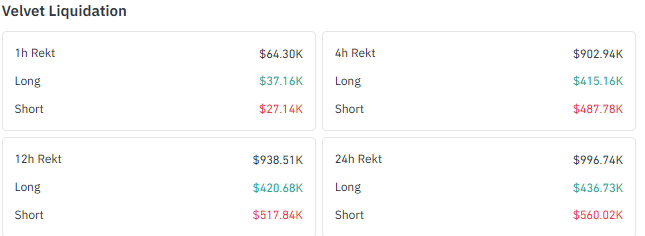
Liquidation data shows short positions taking the larger share across the 24-hour, 12-hour, and 4-hour windows, with $560.02K in short liquidations against $436.73K in longs over the past day.
The gap is real but not extreme, so this looks more like short covering feeding into a broader move than a standalone squeeze driving the rally.
Positioning itself is genuinely split. Binance's general account ratio sits just under 1 at 0.9489, and top trader accounts lean more clearly short at 0.8195, yet top trader positions remain slightly long-biased at 1.1114.
That divergence is worth sitting with rather than simplifying into a single directional read.
Data source: CoinGlass
How Has VELVET Performed Recently?
The token is up 98.12% over the past week and 62.44% over the past month, figures that already stand out before the 90-day gain of 721.96%.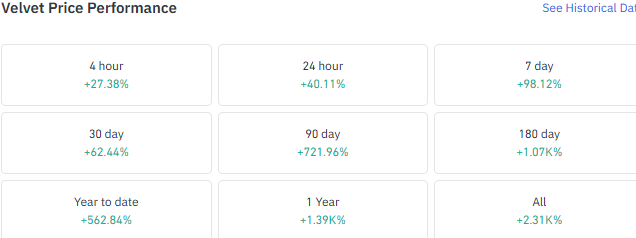
That scale of movement underlines how volatile this asset has been well before the current breakout began. CoinGabbar has also tracked VELVET's earlier rally, which provides useful context for comparing the token's previous expansion with the current move.
Data source: CoinGlass
Is VELVET Repeating Its Earlier Breakout Pattern?
The TradingView Daily chart shows VELVET breaking above a consolidation range that had held roughly between $0.40 and $0.60, with the current candle up and price trading near $1.0010 at the time of capture.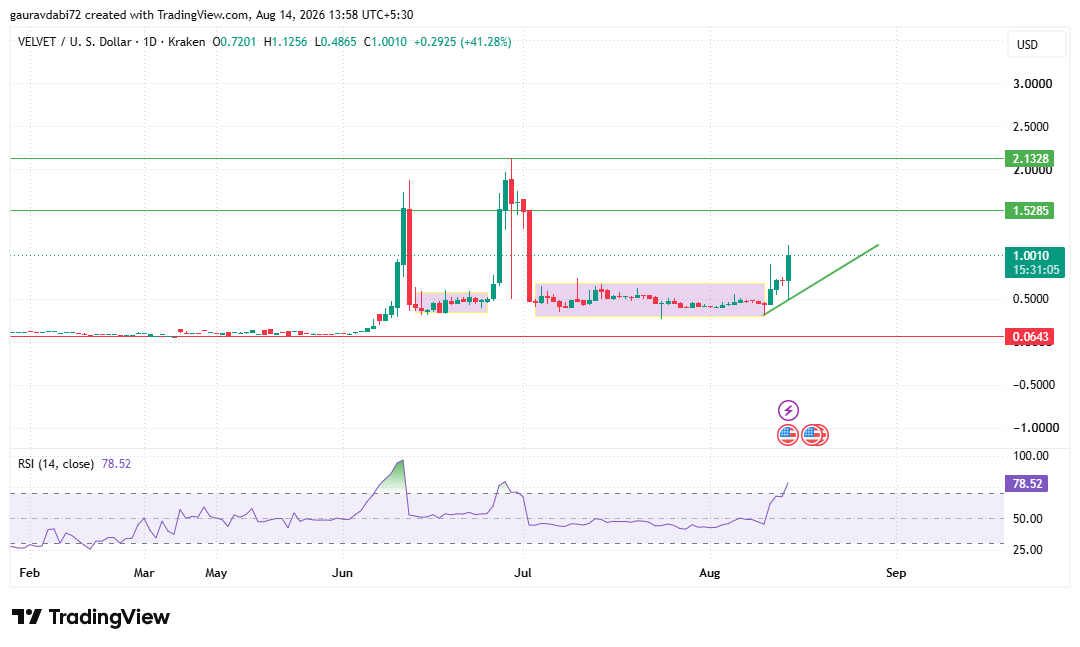
Structure is beginning to shift toward higher highs and higher lows, giving the breakout more technical weight than a standalone price spike.
VELVET has displayed this behavior before. Earlier in 2026, a similar consolidation phase preceded an aggressive expansion that carried price toward the $1.50-$2.00 region before that move faded into another prolonged base.
That historical behavior can also be compared with CoinGabbar's previous coverage of the VELVET price surge.
The current structure resembles that earlier consolidation-to-expansion sequence closely enough to be worth noting, though whether the previous outcome repeats remains unconfirmed.
Daily RSI sits at 78.52, firmly in overbought territory and reflecting the strength of the latest momentum expansion.
That does not mean a reversal is imminent, but a reading this stretched raises the importance of watching how price behaves on any pullback or consolidation rather than assuming an uninterrupted move higher.
VELVET Price Prediction: Can the Rally Reach $1.5285?
If the breakout structure holds and buying pressure continues, $1.5285 becomes the first major resistance area, with $2.1328 only in focus after a convincing move beyond that first level.
A pullback would not automatically undo the breakout given how extended RSI already is.
The more meaningful warning would be losing the broken consolidation region and damaging the higher-low structure now forming.
The deep long-term support at $0.0643 sits far below the current price and only becomes relevant after considerably larger structural deterioration, not as a near-term downside marker.
Scenario | What Matters |
Continuation | The broken consolidation area holds, and buyers maintain control. $1.5285 becomes the first major resistance, with $2.1328 relevant only after stronger continuation. |
Pullback / Failure | The price falls back into the former consolidation area, and the developing higher-low structure weakens. $0.0643 remains deep long-term support rather than an immediate downside level. |
Can Overbought RSI Slow the Rally?
What makes this setup worth watching is less the size of the current candle and more the shape of what preceded it. A prolonged compression phase resolving into an aggressive expansion has happened on this chart before, and the current sequence looks similar.
At the same time, RSI 78.52 and rapidly expanding open interest mean this move carries both stretched momentum and rising leverage, making how the breakout holds up over the next several sessions more important than how far the initial candle traveled.
For additional context, CoinGabbar's earlier analysis of VELVET whale activity provides another reference point for how previous periods of strong price expansion developed.
What We Are Watching Next
As per the CoinGabbar analyst, the key signals from here are whether price holds above the broken consolidation zone, whether the higher-low structure stays intact on any pullback, and whether open interest keeps expanding or starts to unwind.
A clean hold supports the case for the resistance levels above, while a loss of the reclaimed zone would be the first real structural warning.
Disclaimer: This article is for informational purposes only and should not be treated as financial advice. Cryptocurrency markets are highly volatile, and prices can change rapidly. Readers should conduct their own research before making any investment decisions.
Also read:

















