Ripple x402: Can the AI Payments Push Fuel the Next XRP Rally?


Ripple x402 has become one of the most talked-about developments in the XRP ecosystem after Ripple joined the x402 Foundation as a premier member.
The initiative aims to enable AI agents to send and receive payments over the internet using $XRP and RLUSD through the HTTP 402 payment standard.

While Ripple x402 strengthens the long-term utility narrative, traders are also watching $XRP price predictions today, ETF inflows, futures activity, and technical indicators to determine whether the token can finally break out of its year-long downtrend.
Readers can also explore our XRP price prediction 2026 for a broader long-term outlook.
What Is Ripple x402, and Why Does It Matter?
Ripple x402 is built around the HTTP 402 Payment Required standard, allowing applications and AI agents to pay instantly for digital services without relying on traditional payment processors. Instead of subscriptions or API keys, software can make real-time micropayments using $XRP or RLUSD directly on the XRP Ledger.
As AI agents become more autonomous, analysts expect machine-to-machine payments to become a rapidly expanding market. Ripple believes x402 can help position XRPL as one of the payment layers supporting this emerging AI economy. Although adoption is still in its early stages, the initiative strengthens XRP's long-term utility beyond cross-border payments
What is the XRP price doing today?
The altcoin jumped from a weekly open near $1.086 to touch a high of $1.121 before settling back to $1.1083. Weekly trading volume came in at 168.93 million.
The 14-period RSI sits at 34.84, still below the neutral 50 mark. That suggests sellers still have some control, even with today's green candle.
The MACD line remains under its signal line, though the histogram has been shrinking in recent weeks. A cross above zero would be an early sign that momentum is shifting.
Is XRP futures data bullish or bearish right now?
$XRP futures volume over the past 24 hours reached $2.08 billion, up 34.74% from the prior day. Open interest climbed 4.07% to $2.42 billion.
The long/short ratio across accounts stands at 1.0812, showing a slight lean toward long positions. On Binance, the XRP/USDT long/short account ratio is higher at 2.5958, and OKX shows a similar tilt at 2.77.
Liquidation data tells a rougher story for bulls. Over the past 24 hours, $2.69 million in positions were wiped out, and longs took the bigger hit at $680.86K compared to $2.01 million in short liquidations reversed against shorts over the same window.
In the last 12 hours alone, long liquidations totaled $440.13K.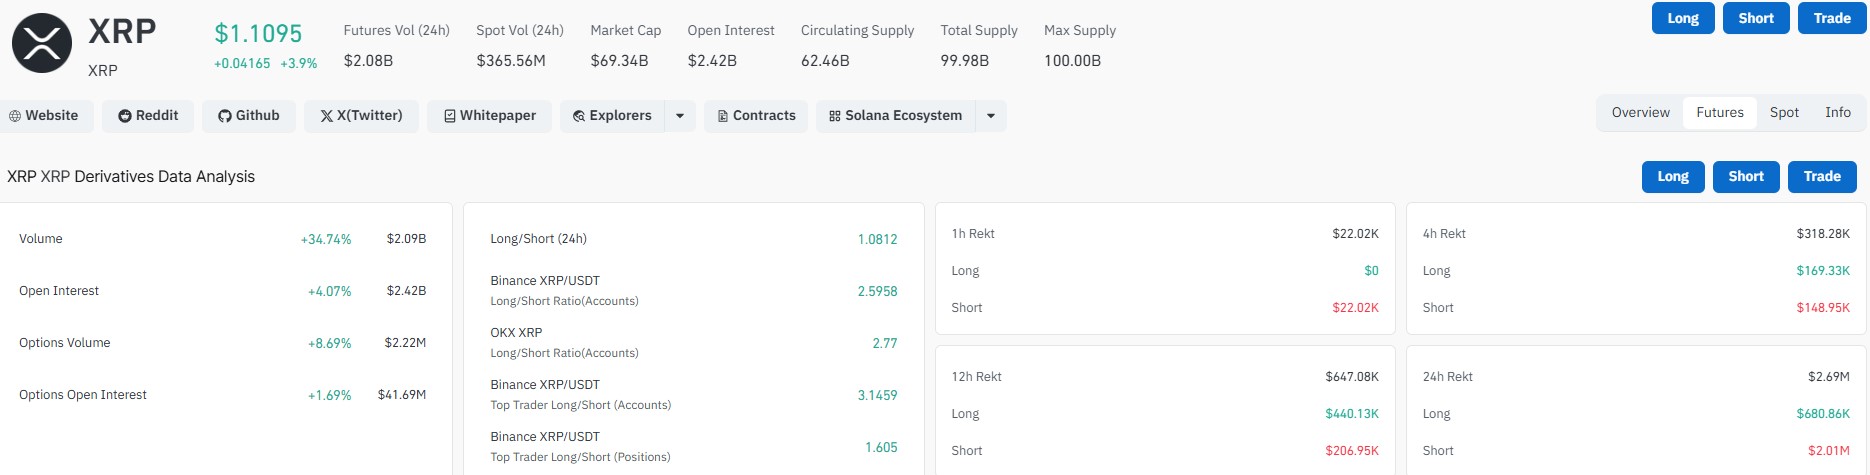
How are XRP ETF inflows trending this month?
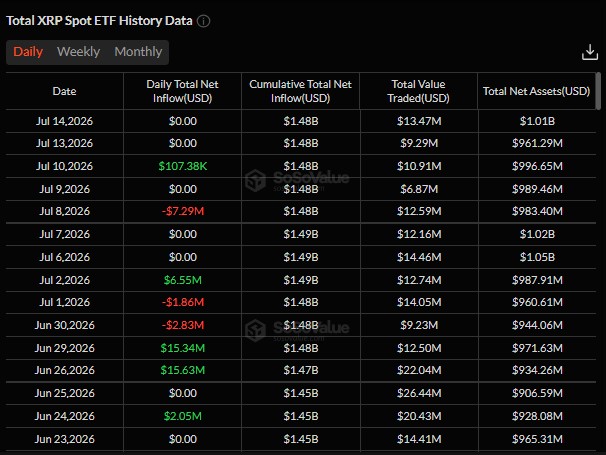
Spot XRP ETF data shows a quiet stretch for new money. On July 14, 2026, daily net inflow was flat at $0.00, matching several other sessions this month, including July 13, July 7, and June 30.
There have been a few bright spots. July 10 brought in $107.38K, and June 29 saw a stronger $15.34 million inflow. Cumulative total net inflow into XRP spot ETFs has held steady around $1.48 billion since late June.
Total net assets across these funds sit near $1.01 billion as of July 14, based on the most recent daily figures.
Date | Daily Net Inflow | Cumulative Inflow | Total Net Assets |
Jul 14, 2026 | $0.00 | $1.48B | $1.01B |
Jul 10, 2026 | $107.38K | $1.48B | $996.65M |
Jul 8, 2026 | -$7.29M | $1.48B | $983.40M |
Jun 29, 2026 | $15.34M | $1.48B | $971.63M |
Jun 26, 2026 | $15.63M | $1.47B | $934.26M |
XRP Support and Resistance Levels
On the daily chart, the altcoin is trading right at the lower edge of a descending channel that started forming after the July 2025 top near $3.65.
Price is now testing that lower trendline directly, with the current candle sitting between $1.0990 and $1.1139.
This lower boundary lines up closely with the $1.00 to $1.10 zone. A daily close below this trendline would signal a breakdown, while a bounce here would keep the channel structure intact.
The upper trendline of the channel has been sloping down for months and now sits much lower than it did last year, currently tracking somewhere near the $1.30 to $1.40 area.
That's a big drop from the $2.40 region the same trendline marked back in January 2026.
Below current price, the psychological $1.00 level remains the key line traders are watching. The altcoin has wicked below that mark multiple times since June without a daily close under it.
RSI sits at 47.28, just under the neutral 50 line, showing the momentum is flat rather than strongly bearish or bullish. MACD remains slightly negative at -0.0128, though the histogram has been narrowing.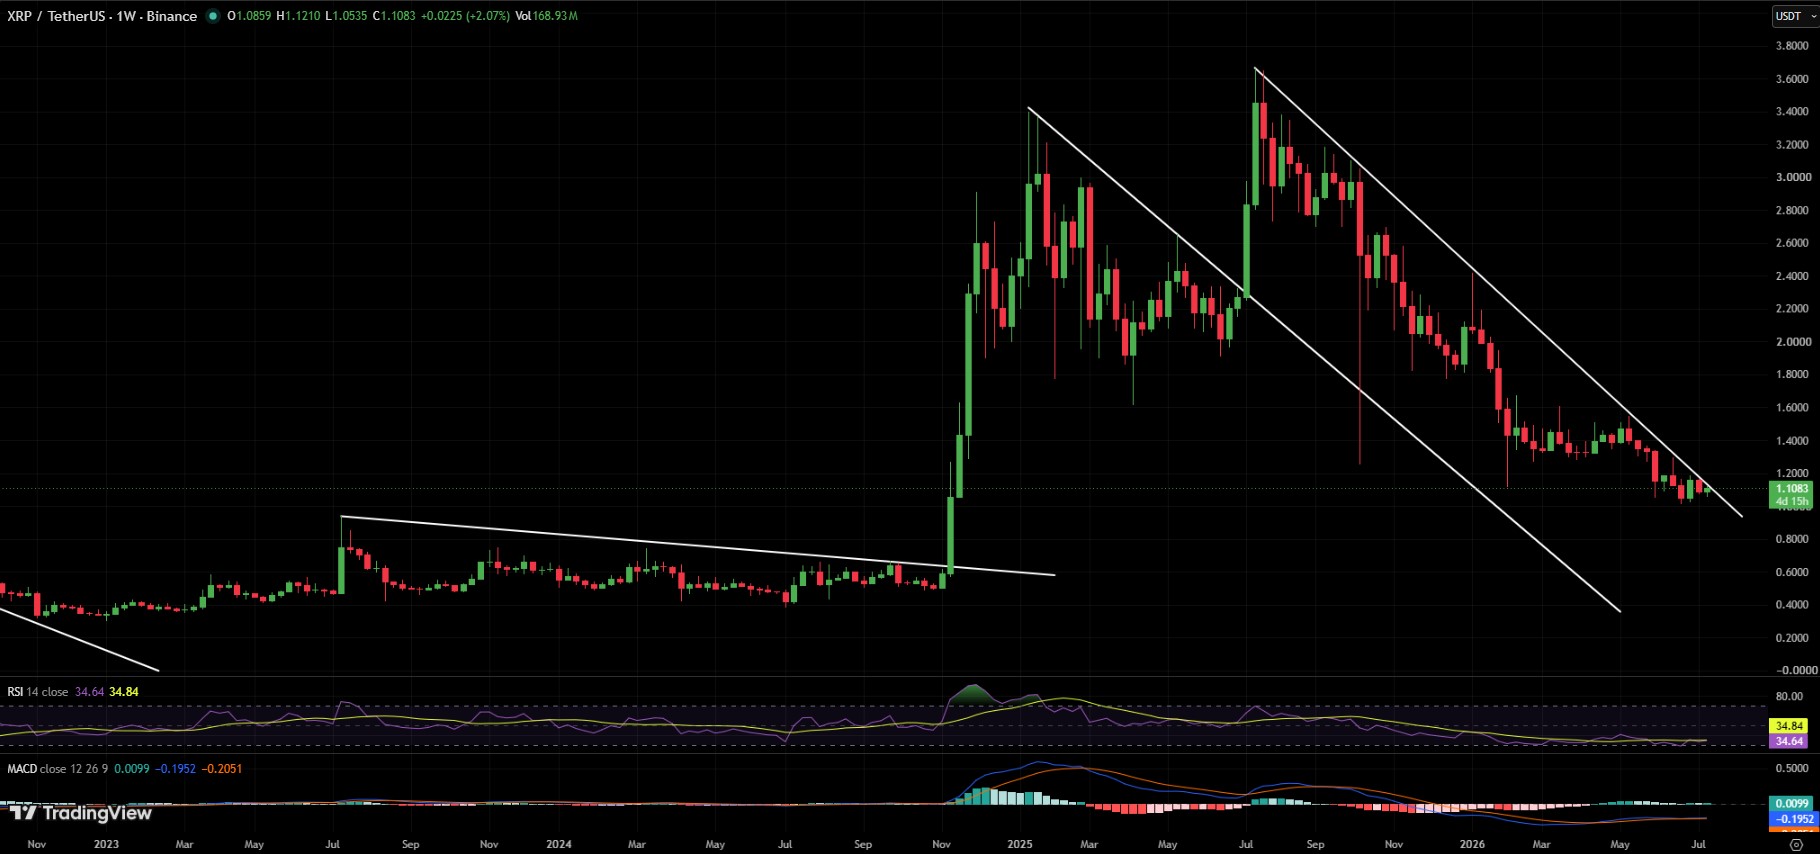
Level Price Immediate Support $1.00 Major Support $0.92 Resistance 1 $1.20 Resistance 2 $1.35 Major Resistance $1.50
Traderslooking for a deeper technical breakdown can also explore our XRP support and resistance levels guide.
What Indicators Support the XRP Price Forecast?
The current outlook is based on multiple technicalindicators rather than a single chart pattern. Traders are monitoring:
RSI for momentum recovery
MACD crossover for trend confirmation
50 EMA and 200 EMA for long-term direction
XRP trading volume during breakout attempts
ETF inflows for institutional demand
Futures open interest for leverage positioning
Combining these indicators provides a probability-based view instead ofrelying on one bullish or bearish signal.
How XRP ETFAre Flows Affecting Price?
Spot XRP ETF inflows remain one of the strongestinstitutional indicators for the asset.
Althoughdaily flows have slowed during July, cumulative inflows continue to hold near $1.48 billion, suggesting that long-term investors have largely maintained exposure.
Historically,sustained ETF buying has supported stronger price trends by reducing availablemarket supply and improving overall investor confidence.
WhatAre Analysts Predicting for XRP?
| Analyst | Target |
| Standard Chartered | Around $2.80 base case |
| EGRAG Crypto | $7-$10 cycle target |
| Current Technical Model | $1.40-$1.50 after breakout |
These projections use different methodologies ranging from institutional adoption andETF demand to Fibonacci extensions, moving averages, and long-term marketcycles. Investors should treat them as scenarios rather than guaranteed outcomes.
Bull, Base and Bear Scenarios
| Scenario | Target | Probability | Invalidation |
| Bull | $1.50-$2.00 | 30% | Daily close below $1.00 |
| Base | $1.20-$1.40 | 50% | Failure to reclaim $1.20 |
| Bear | $0.85-$1.00 | 20% | Weak ETF demand & breakdown |
Where could $XRP price go next?
Ripple x402 adds a meaningful long-term utility narrative by positioning XRP for AI-powered internet payments, but price action still depends on technical confirmation and institutional participation.
A breakout above $1.20, supported by stronger trading volume, improving RSI, positive MACD crossover, and renewed ETF inflows, would improve the bullish outlook.
Until then, traders should monitor the $1.00 support, futures positioning, and broader market sentiment before expecting a sustained recovery.
Disclaimer
This article is for informational purposes only and does not constitute financial, investment, or trading advice. Cryptocurrency markets are highly volatile and unpredictable. Past performance is not indicative of future results. Always conduct your own research and consult a licensed financial advisor before making any investment decisions.

















