XRP Price Slips Toward $1 Psychological Level as Longs Get Liquidated

XRP is under pressure again. The token slipped 2.65% in the past 24 hours, trading near $1.0048 after rejecting the $1.06 resistance zone earlier this week. That move pushed the token to a fresh 2026 low, and traders are now watching to see if the $1 mark can hold.
The weekly chart isn't much better. It is down 6.40% over seven days, and the pain is spreading across spot, futures, and the network itself.
August has a bit of a reputation among holders of the coin. It's historically one of its weaker months, and this year, with midterm elections adding extra noise to markets, that pattern seems to be repeating.
Why Is XRP Price Dropping Today?
Three things are hitting the token at once: cooling ETF demand, falling network activity, and a wave of long liquidations.
None of these is catastrophic on its own. Together, they've created enough selling pressure to drag the price toward a key psychological line.
XRP ETF Inflows Have Gone Quiet
Spot ETFs tied to the token had a strong run building up their asset base, but the daily inflow numbers tell a different story lately.
| Date | Daily Net Inflow | Cumulative Net Inflow | Total Value Traded | Total Net Assets |
| Aug 3, 2026 | $1.15M | $1.51B | $9.99M | $1.00B |
| Aug 4, 2026 | $0.00 | $1.51B | $7.49M | $1.00B |
| Aug 5, 2026 | -$3.58M | $1.51B | $20.16M | $993.38M |
| Aug 6, 2026 | $3.45M | $1.51B | $13.66M | $964.21M |
| Aug 7, 2026 | $0.00 | $1.51B | $15.79M | $953.19M |
| Aug 10, 2026 | $0.00 | $1.51B | $11.95M | $950.05M |
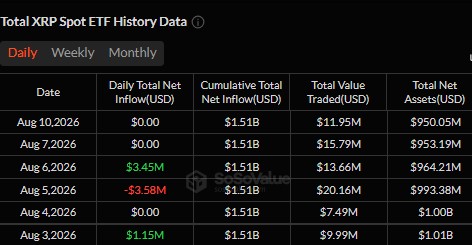
Source: SoSoValue XRP ETF Data
Cumulative net inflow has stayed flat at around $1.51 billion for over a week now. That means fresh money isn't really coming in.
Total net assets tell the clearer story. They dropped from $993.38 million on August 5 to $950.05 million by August 10. That's a drop of roughly $43 million in five trading days, driven mostly by the falling price itself rather than fund outflows.
Zero net inflows on two of the last three reported days is the detail worth watching. Without new buying through the ETF wrapper, there's less of a cushion when spot sellers show up.
XRP Ledger Activity Is Cooling Off
It's not just the ETF side. On-chain activity has slowed too.
Ledger transactions fell from about 2.81 million on August 5 to 1.57 million on August 9. That's a decline of roughly 44% in just four days.
Fewer transactions usually point to less day-to-day demand for the network. It doesn't mean the token is broken, but it does line up with the weaker price action.
How Much Was Liquidated in the Last 24 Hours?
This is where things got rough for leveraged traders.
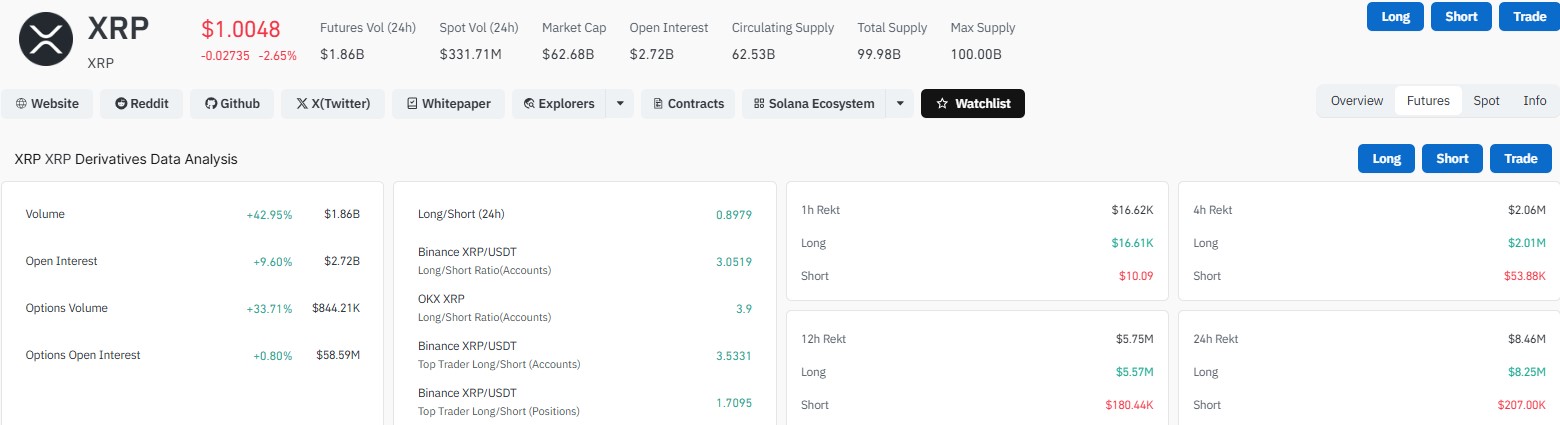
According to CoinGlass data , the token saw about $8.46 million in liquidations over 24 hours. Long positions accounted for $8.25 million of that, or roughly 97.55% of the total. Short liquidations were tiny by comparison, just over $207,000.
Broken down by timeframe, the pain built up gradually:
| Timeframe | Total Liquidated | Long Liquidations | Short Liquidations |
| 1 hour | ~$16.72K | $16.61K | $10.09 |
| 4 hours | ~$2.06M | $2.01M | $53.88K |
| 12 hours | ~$5.75M | $5.57M | $180.44K |
| 24 hours | ~$8.46M | $8.25M | $207.04K |
Source: CoinGlass
When long traders get squeezed like this, it usually adds fuel to a falling price, since forced selling piles on top of the original move down.
Futures data also shows open interest still rising, up 9.60% to $2.72 billion, even as price falls. That combination, rising leverage plus falling price, tends to keep volatility elevated.
Are XRP Whales Still Buying?
Not everyone is running for the exits. Large holders appear to be doing the opposite.
Whale wallets added around 380 million tokens over the past week, bringing their combined holdings to roughly 8.1 billion tokens. That's close to 13% of its total circulating supply.
This kind of accumulation during a price dip is often read as a sign that bigger players see the current levels as a buying opportunity, though it's worth remembering that whale activity alone doesn't guarantee a bottom is in.
What's Next for XRP Price?
The near-term picture depends a lot on macro timing. The next U.S. CPI inflation report lands on August 12, and traders across crypto markets tend to reduce risk exposure right before events like this.
Regulatory news is adding to the pressure. The Senate left for recess without voting on the CLARITY Act, the bill meant to set clear U.S. crypto rules.
A procedural vote is now set for September, needing 60 votes to pass. Lawmakers remain split on key provisions, and prediction markets show fading confidence in 2026 passage.
On the charts, it closed a recent weekly candle at $1.09, right after breaking below a price floor that had technically held for close to two years. That's a meaningful technical shift, even if the token is still trading close to that old line.
For now, $1 is the level to watch. If the price can hold above it, a period of sideways consolidation looks like the more likely outcome. A clean break below $1, though, could open the door toward the $0.94 area.
None of this is set in stone. Crypto markets move fast, and a single macro surprise or a shift in ETF flows could change the setup within days.
Disclaimer
This article is for informational purposes only and does not constitute financial, investment, or trading advice. Cryptocurrency markets are highly volatile and carry significant risk, including the potential loss of principal. Prices, liquidation figures, and fund flow data referenced here reflect information available at the time of writing and are subject to change. Always conduct your own research and consult a licensed financial advisor before making investment decisions.

















