Zerobase Price Prediction: $ZBT Down 35% Today, Oversold Bounce Ahead


$ZBT is trading around $0.09336 right now, down a sharp 35% in the last 24 hours alone.
This Zerobase Price Prediction breaks down what the charts are showing after this steep drop and whether the deeply oversold reading on the short-term chart points to a real bounce or just a pause before more downside.
Zerobase is a decentralized cryptographic infrastructure network that uses zero-knowledge proofs and trusted execution environments to enable verifiable off-chain computation, powering products like zkStaking and zkLogin.
ZBT rallied into mid-July before getting rejected hard at resistance, and the token has now broken down sharply, landing right in oversold territory on the short-term chart.
Zerobase Price Prediction: Market Overview
Metric | Value |
Current Price | $0.09336 |
24h Change | -35% |
7d Change | -21.7% |
1h Change | +6.3% |
24h Range | $0.08626 – $0.148 |
Market Cap | $95.456M |
Fully Diluted Valuation | $95.456M |
24h Trading Volume | $33.545M |
Total Value Locked (TVL) | $54.655M |
Circulating Supply | 1B $ZBT |
Total / Max Supply | 1B $ZBT |
Source: Data from CoinGecko
Zerobase Price Prediction: $ZBT Liquidation and Volume Data
Leverage has been getting cleared out hard as ZBT fell. 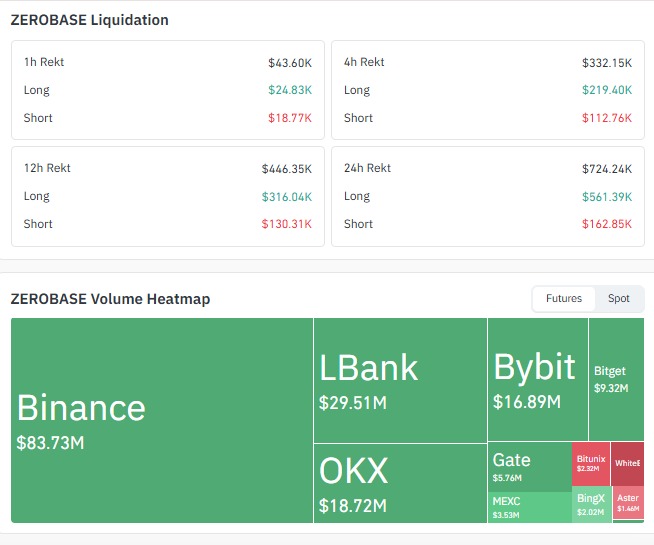
Source: Data From CoinGlass
Over the last 24 hours, ZBT saw $724.24K in total liquidations, with $561.39K coming from long positions against $162.85K in shorts, showing leveraged buyers took the brunt of this decline.
That imbalance holds across every window, with $316.04K in long liquidations in just the last 12 hours alone, confirming this was a fast, aggressive flush of leveraged long positions rather than a slow bleed.
Futures trading volume remained heavy through the drop, led by Binance at $83.73M, with LBank at $29.51M, OKX at $18.72M, and meaningful volume also flowing through Bybit, Gate, Bitget, MEXC, BingX, Bitunix, and Whitebit.
That kind of volume indicates traders were actively getting positioned around ZBT throughout the move and not sitting on the sidelines.
ZeroBase Price Prediction: Short-Term Chart Analysis
On the 1-hour chart of $ZBT, 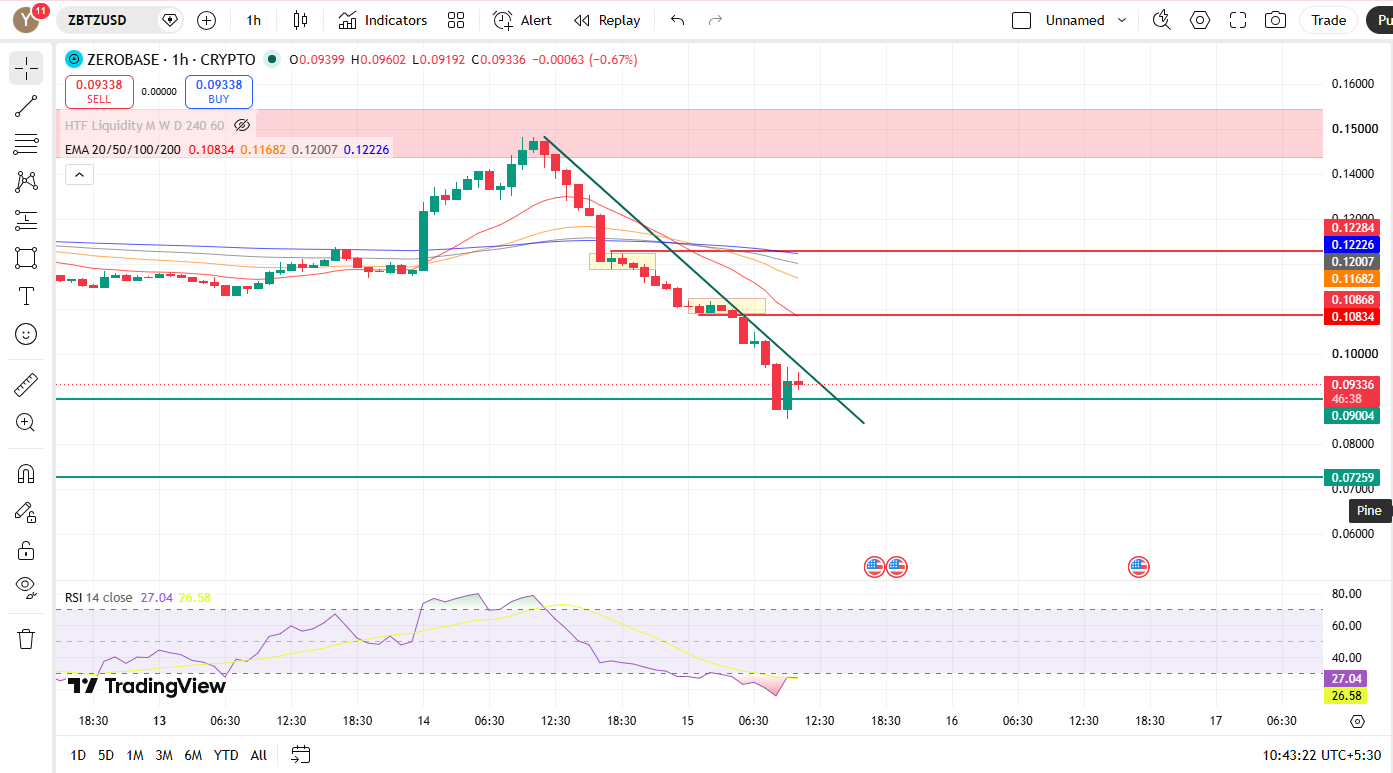
Price is trading below a clear falling trendline that has stopped every recovery attempt since the token broke out earlier this week.
The price fell sharply from a resistance zone near the top of the chart before settling into the current range.
Price is trading well below every EMA on this timeframe (EMA 20 at $0.10834, $EMA 50 at $0.11682, EMA 100 at $0.12007, and $EMA 200 at $0.12226), confirming the short-term trend remains firmly bearish.
RSI has dropped to 27.04, below its 26.58 moving average level, a deeply oversold reading that often precedes at least a short-term bounce, even within a broader downtrend.
The view is if $ZBT break the trendline, then the important levels to see are
ZeroBase Price Prediction: $ZBT Short-Term Key Levels
Support Levels | Resistance Levels |
$0.09004 | $0.10868 |
$0.07259 | $0.12284 |
ZeroBase Price Prediction: Long-Term Chart Analysis
On the daily chart, 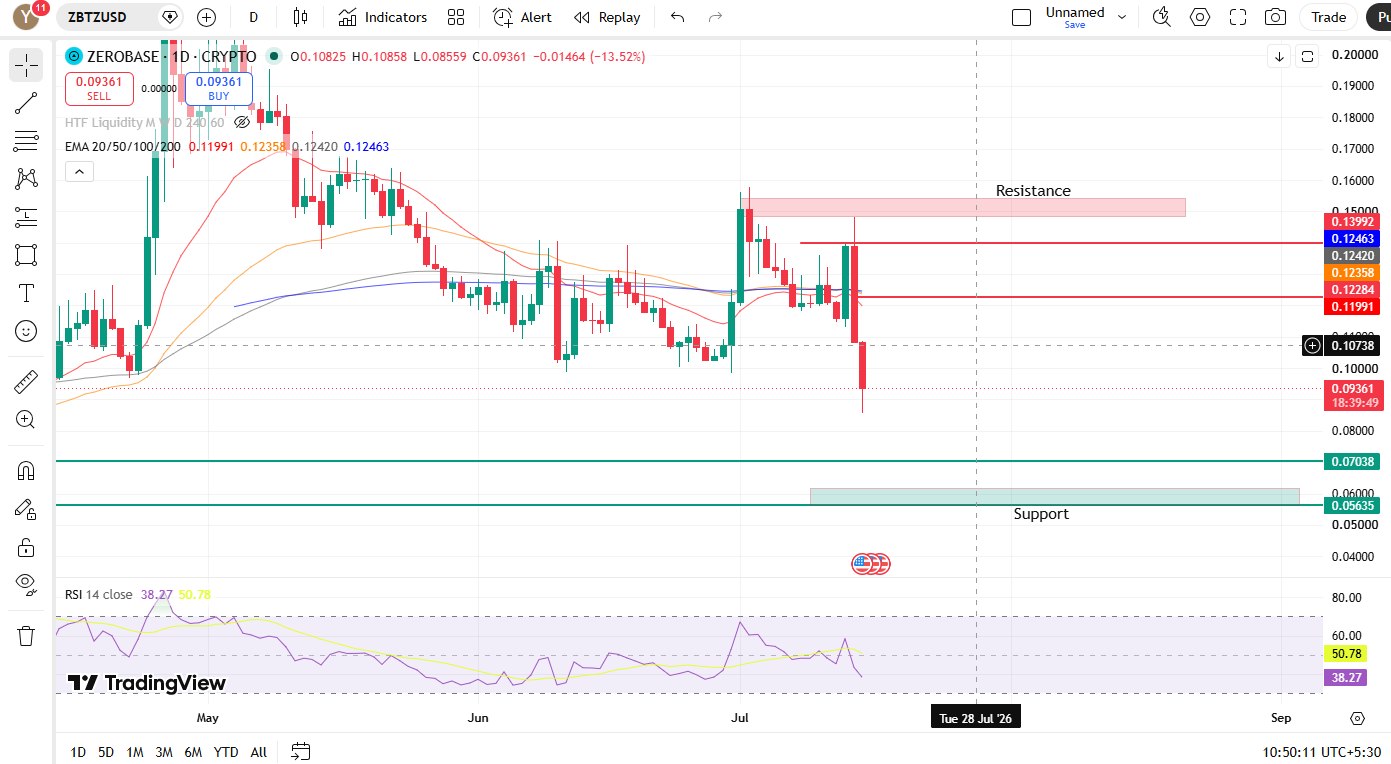
ZBT rallied hard into mid-July before getting rejected at a resistance zone and posting a sharp red candle.
That kind of move after a failed breakout typically signals aggressive profit-taking from traders who bought the earlier rally.
Price sits below every daily EMA as well (EMA 20 at $0.11991, EMA 50 at $0.12358, EMA 100 at $0.12420, and EMA 200 at $0.12463), and daily RSI at 38.27 sits below its 50.78 moving average level.
ZeroBase Price Prediction: $ZBT Long-Term Key Levels
Support Levels | Resistance Levels |
$0.07038 | $0.12284 |
$0.05635 | $0.13992 |
Zerobase Price Prediction: Expert View
As per the market analyst, ZBT is showing the classic signs of a sharp correction after a failed breakout, with price rejected at resistance and now trading below every EMA on both time frames.
The deeply oversold RSI reading on the 1-hour chart, combined with the small bounce already showing up over the last hour, suggests a short-term relief move is plausible even while the broader trend stays bearish.
Reclaiming $0.10868 would be the first real sign of stabilization, while a break below $0.09004 would open the door toward $0.07259 and then the deeper daily support near $0.07038.
Disclaimer: This content is for informational purposes only and is not financial advice. Crypto markets are highly volatile; always do your own research before making any investment decisions.

















