Synapse Price Prediction 2026: Can SYN Hold Key Support and Recover?

Synapse price prediction (SYN) trades at $0.1778, up 121.86% in 24 hours, recorded at 15:14 UTC on September 16, 2026. The 7-day move shows a sharp reversal out of a multi-week falling pattern. Market cap sits near $42.13M, up 124.04%. Volume jumped to $93.5M, up 845.72%. The trend has flipped bullish. RSI reads 79.33, deep overbought. Immediate support holds close to $0.10, and resistance sits near $0.21. The next trigger is a daily trade above $0.21 or a slip back under the breakout line. Background on the setup is covered in this SYN breakout bull-bear case analysis.
Synapse Price Prediction 2026: Quick Overview
Metric | SYN |
Current Price | $0.1778 |
24H Change | +121.86% |
7D Change | +77.34% (daily candle) |
Market Cap | $42.13M |
Trading Volume | $93.5M |
Trend | Bullish |
RSI | 79.33 (Overbought) |
Immediate Support | $0.10 |
Major Support | $0.0774 |
Immediate Resistance | $0.21 |
Breakout Target | $0.302 |
Breakdown Target | $0.0774 |
Bull Case | $0.30 – $0.44 |
Base Case | $0.13 – $0.18 |
Bear Case | $0.08 – $0.10 |
Invalidation | Trading below $0.0774 |
Source: Data by CoinMarketCap
SYN Price Prediction: What Is Happening Right Now?
$SYN broke out of a falling wedge that had been building since late July. Trading opened at $0.099 and hit an intraday high of $0.217 before settling near $0.178.
Volume exploded to $93.5M, nearly nine times the prior session. That's not a quiet move.
And the structure now shows a clean higher high against the wedge resistance line, with support parked at $0.0774. Momentum traders are watching whether the $SYN price today can hold this range or fade back into the pattern.
Synapse Technical Analysis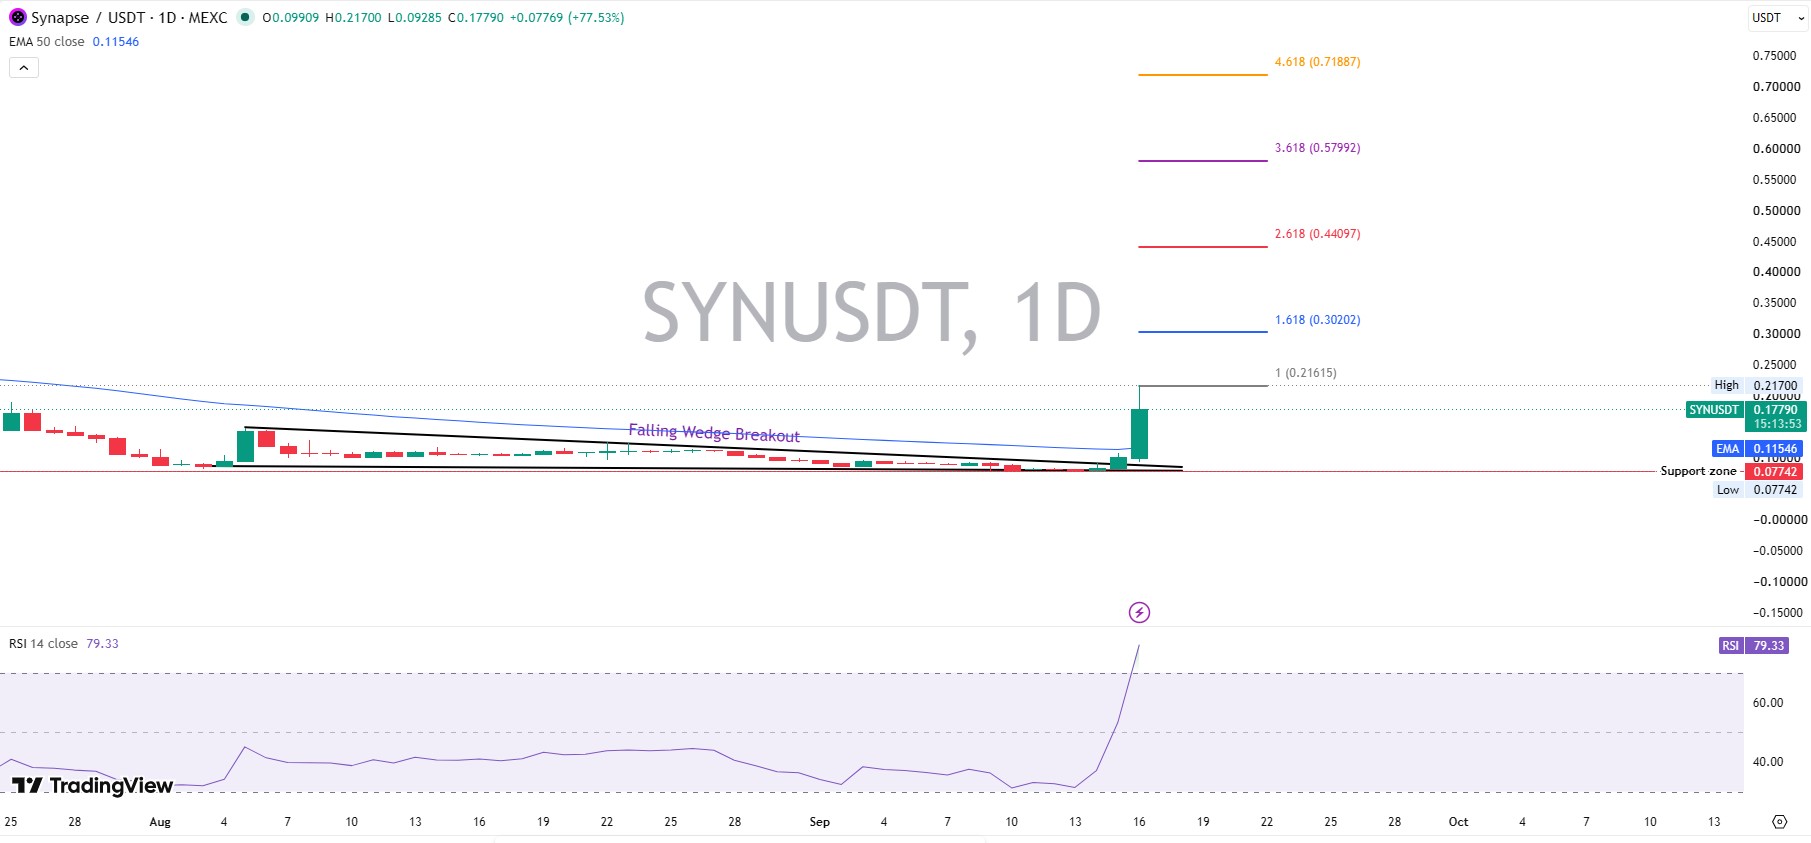
SYN Trend Analysis
Short-term trend: strongly bullish, driven by the wedge breakout. Medium-term trend: recovering, after months of consolidation near cycle lows.
Long-term trend: still bearish on a wider lens. $SYN remains 96.4% below its October 2021 all-time high of $5.01. But it's also up 560.41% from its June 2026 all-time low of $0.02736.
$SYN Support Levels
Immediate support sits at $0.10, the zone where trades stalled repeatedly through August. Secondary support lines up with the EMA 50 at $0.1155.
Major support is $0.0774, the wedge's lower boundary. A breakdown below this level would undo the entire breakout thesis.
$SYN Resistance Levels
Immediate resistance sits at the session high of $0.217. Breakout resistance lines up with the Fibonacci 1.618 extension at $0.302.
Major resistance sits far out at the 2.618 extension, $0.44097. That level only comes into play if volume stays elevated for several sessions.
$SYN RSI Analysis
RSI (Relative Strength Index, a momentum gauge from 0-100) reads 79.33 on the daily chart. Anything above 70 signals overbought conditions.
No bearish divergence shows yet. But a reading this high rarely holds for long without a pullback first.
$SYN MACD Analysis
The MACD (Moving Average Convergence Divergence, a trend-momentum indicator) line sits at 0.00047, just crossing above the signal line at -0.00706. The histogram reads 0.00753 and turning positive.
That's a fresh bullish crossover. Confirmation would need one or two more sessions of trading above the signal line.
$SYN Volume Analysis
Breakout with rising volume signals stronger confirmation, and this move qualifies. Volume near $93.5M dwarfs the multi-week average.
A breakout with falling volume would signal a weak, fadeable move. That's not what the data shows here. Whales noticed first.
Synapse Breakout and Breakdown Scenarios
What Happens If $SYN Breaks Resistance?
A confirmed trade above $0.217 opens the door to $0.302, the first Fibonacci extension target. Confirmation needs a daily trade, not just a wick.
From there, the next target sits at $0.441, with an extension toward $0.579 if broader market conditions stay supportive.
What Happens If $SYN Loses Support?
A trade back under $0.10 sends the price toward the wedge floor at $0.0774. Losing that zone risks a retest of the June 2026 low near $0.0274.
Recovery from there would require renewed volume and a reclaim of $0.10 on a daily trade basis.
Synapse Price Prediction 2026
Scenario | SYN Price Range | Conditions |
Bear Case | $0.08 – $0.10 | Major support breaks, volume fades |
Base Case | $0.13 – $0.18 | Range holds, gradual recovery |
Bull Case | $0.30 – $0.44 | Resistance breakout, volume expansion |
Every target above ties back to the Fibonacci extension grid drawn off the wedge low, not a random guess.
Can $SYN Reach $0.10 in 2026?
SYN already trades above $0.10, at $0.1778. So the real question isn't whether it reaches that mark; it's whether it holds above it.
Market Cap Required for $0.10 SYN
Using a circulating supply of 236.94M SYN, a $0.10 price implies a market cap near $23.69M. The current market cap sits at $42.13M, already well above that threshold.
Compared with ZRO's $356.6M cap, W's $57.14M, AXL's $53.68M, and STG's $20.45M, Synapse's implied $0.10 valuation looks modest against most peers. Turns out, the harder question now is whether SYN can defend this level through year-end.
SYN vs. Other Cross-Chain Tokens
SYN vs ZRO (LayerZero)
LayerZero focuses on omnichain messaging infrastructure. ZRO trades at $0.9525, market cap $356.6M, TVL $7.07B, far larger in scale than SYN. A detailed LayerZero price prediction covers its own support and resistance setup.
SYN vs W (Wormhole)
Wormhole runs cross-chain messaging across dozens of networks. W trades at $0.008844, market cap $57.14M, with volume of $115.81M outpacing its own cap. The full Wormhole price prediction breaks down its recovery outlook.
SYN vs AXL (Axelar)
Axelar provides cross-chain communication infrastructure. AXL trades at $0.04333, market cap $53.68M, down 12.09% over 24 hours as of this snapshot.
SYN vs STG (Stargate)
Stargate centers on cross-chain liquidity and asset bridging. STG trades at $0.1454, market cap $20.45M, holding 973.82K addresses. Its own Stargate price prediction ties the outlook to a recent token burn.
SYN vs Leading Cross-Chain Tokens, Comparison
Metric | SYN | ZRO | W | AXL | STG |
Category | Interoperability | Messaging | Interoperability | Interoperability | Cross-chain liquidity |
Market Cap | $42.13M | $356.6M | $57.14M | $53.68M | $20.45M |
24H Volume | $93.5M | $52.83M | $115.81M | $15.63M | $8.66M |
24H Change | +121.86% | +0.43% | -8.28% | -12.09% | -3.73% |
SYN is being evaluated mainly as a cross-chain interoperability asset. ZRO leans on omnichain messaging volume, W on Wormhole's broader infrastructure reach, AXL on cross-chain communication tooling, and STG on liquidity depth for asset transfers.
What Could Drive SYN Higher in 2026?
Hypercall Adoption
Hypercall, Synapse's trading venue on Hyperliquid, launched daily trading rewards on September 14, 2026 at 18:00 UTC, splitting $1,000 between maker and taker pools. This is confirmed and live, not speculative. The rollout is listed on the site's coin events calendar alongside other near-term launches. Broader adoption beyond this pilot remains unconfirmed.
Synapse Ecosystem Growth
Continued expansion of Hypercall's asset intelligence tools could pull fresh trading activity toward SYN-linked markets. Broader price prediction coverage tracks how these ecosystem shifts play out across other tokens.
Cross-Chain Adoption
Wider bridge usage across chains supported by Synapse would lift protocol fees and, in turn, demand for SYN. Reward pilots like Hypercall's sit close to the kind of activity tracked on the crypto airdrops page.
Exchange Liquidity
Deeper order books on major exchanges would reduce slippage and support larger trades without destabilizing price. Fresh entries on the crypto exchange listing page would be one signal worth tracking.
Bitcoin and Altcoin Market Direction
A risk-on broader crypto market tends to amplify small-cap breakouts like this one. A risk-off shift does the opposite, fast. Even sentiment in corners like memecoin market news tends to move in step with small-cap risk appetite.
Competition With ZRO, W, AXL and STG
SYN's smaller market cap gives it more room to re-rate versus larger peers, but it also means thinner liquidity and sharper swings.
SYN Risks to Watch in 2026
Support Breakdown
A daily trade below $0.0774 would invalidate the entire wedge breakout thesis.
Weak Trading Volume
If volume fades toward the pre-breakout average, the rally risks stalling before reaching resistance.
Cross-Chain Competition
Against ZRO, W, AXL, and STG, Synapse holds the smallest market cap of the group by a wide margin.
Whale Selling
Etherscan data shows the top 100 wallets hold 93.17% of supply, with whale wallets alone controlling 82.34%. Concentration at this high raises real sell-pressure risk.
Liquidity Risk
Volume-to-market-cap ratio near 213% signals a thin float getting pushed hard. That cuts both ways.
Broader Crypto Market Weakness
A wider downturn would likely drag SYN back toward support regardless of its own chart structure. Sector rotation, including flows tied to AI token news, often sets the tone for smaller-cap moves like this one.
SYN Bull Case vs Base Case vs Bear Case
Bull Case: Resistance breakout, plus volume expansion, plus a positive broader market, points toward the $0.30-$0.44 zone.
Base Case: Support holds, range continues, moderate volume, keeps SYN inside $0.13-$0.18.
Bear Case: Major support breaks, volume confirms selling, and altcoin weakness spreads. That combination points toward $0.08-$0.10, and possibly lower.
SYN Trader Levels to Watch
Level | Meaning | Confirmation |
Support 1 | Immediate defense | Price rejection near $0.10 |
Support 2 | Major support | Buying response near $0.0774 |
Resistance 1 | Near-term barrier | Daily trade above $0.217 |
Resistance 2 | Breakout level | Trade plus volume above $0.302 |
Bull Target | Upside objective | $0.30 – $0.44 |
Bear Target | Downside objective | $0.08 – $0.10 |
Invalidation | Thesis failure | Confirmed trade below $0.0774 |
This chart just posted one of its biggest single-day moves of the year. Whether it holds is the only question that matters now.
Disclaimer
This article is for informational purposes only and does not constitute financial, investment, or trading advice. Cryptocurrency markets are highly volatile, and prices can change rapidly. Readers should conduct independent research and consult a qualified financial advisor before making any investment decisions. Past performance and technical patterns do not guarantee future results.













.jpg)




