ZFORGE Price Prediction 2026-2030: Buy, Wait, or Watch These Levels?

ZFORGE is extremely new, and that changes how any forecast should be read. The token's trading history runs to days, not months, so long-term technical certainty isn't really on the table yet.
ZFORGE Price Prediction: Price data also varies across trackers, sometimes by a wide margin. For a fuller picture of how new listings tend to behave early on, broader altcoin coverage is worth checking alongside this piece. This article leans on scenarios rather than one guaranteed number, since a single confident target for a token this young would be misleading.
ZFORGE Price Prediction: Quick Market Snapshot
Data below reflects a snapshot near 09:40 UTC on September 19, 2026, pulled from CoinGecko's ZECFORGE listing. Numbers move fast on a token this new, so treat this table as a moment in time, not a running total.
Metric | Current Data |
ZFORGE Price | $0.02218 (CoinGecko) |
24H Change | +2234.5% |
24H High | $0.02489 |
24H Low | $0.0000007639 |
Market Cap | $24.894M |
FDV | $24.894M |
24H Volume | $570.185M |
Total Supply | 1,000,000,000 ZFORGE |
Circulating Supply | Not reported |
Main Market | ZFORGE/WETH |
Analysis Time (UTC) | 09:40, September 19, 2026 |
CoinGecko reports a total supply of one billion tokens but no confirmed circulating supply. That gap matters more than it sounds, since every long-term target further down assumes a supply figure.
Why Is $ZFORGE Price Data Different Across Crypto Sites?
Three separate sources gave three different prices within the same hour. GeckoTerminal showed the pair trading near $0.02032. CoinGecko listed $0.02218. The Robinhood Chain explorer showed $0.01387523. None of them are wrong, exactly.
Each pulls from a different slice of the market. Aggregators track different liquidity pools, and a token trading through a live pool can price differently than the same token viewed on an explorer snapshot.
Timestamps rarely line up, either. One site refreshes every few seconds. Another caches for minutes. On a token moving 45% in an hour, that lag alone explains a lot of the mismatch.
Thin trading history is the bigger issue, though. A handful of large trades can move the average price shown across trackers. That's just where a brand-new listing sits, and it won't resolve until deeper markets form.
ZFORGE Technical Analysis and Key Levels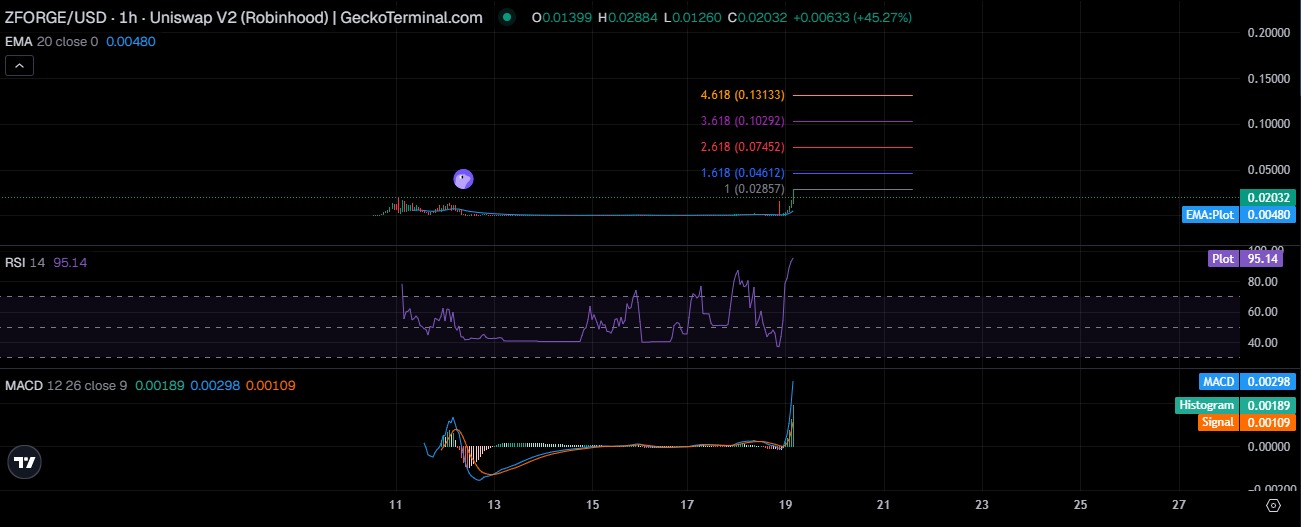
ZFORGE Support Levels
The one-hour chart on Uniswap V2 (Robinhood Chain) shows a low of $0.01260 for the current session, a floor that held before buyers pushed the token higher. A deeper zone sits near the 20-period EMA (exponential moving average) at $0.00480. That gap from current trading is wide enough that reaching it would mean a sharp pullback, not a routine dip.
ZFORGE Resistance Levels
The session high of $0.02884 marks immediate resistance. Above that, Fibonacci extension levels plotted on the chart line up at 0.04612, 0.07452, 0.10292, and 0.13133. Those are speculative zones, not confirmed ceilings, and reaching them would need serious follow-through buying.
ZFORGE RSI and Momentum
The 14-period RSI (Relative Strength Index) reads 95.14 on the hourly chart, deep into overbought territory. When we pulled up the momentum indicators together, MACD showed a line value of 0.00298 against a signal of 0.00109, with a rising histogram. Momentum points up right now.
But an RSI above 90 rarely holds without a cooldown. Timing matters here.
ZFORGE Volume Analysis
Reported 24-hour volume near $570.185M against a market cap around $24.894M is an unusual ratio. That combination, paired with thin liquidity, tends to mean a small number of large trades drive most of the action. Price movement, volume, and liquidity need reading together here, not volume alone, and that's worth tracking through ongoing exchange listing updates.
ZFORGE Price Prediction 2026
Three outcomes seem realistic for the rest of 2026. Bear case: a retreat toward $0.015 to $0.020 if volume dries up and early holders take profit. Trigger: RSI cooling sharply below 50 alongside falling volume.
Base case: consolidation between $0.025 and $0.035, digesting the recent spike rather than trending hard either way.
Bull case: a push toward $0.050 to $0.075 if new liquidity enters and the token holds attention past launch week.
Trigger: daily volume above $50M alongside fresh exchange coverage.
Invalidation: a drop back below the $0.0₆7639 all-time low, or a sustained volume collapse, undercuts both the bull and base cases.
ZFORGE Price Prediction 2027-2030
Because ZFORGE is a very new token and current data providers show materially different prices, a market-cap-based model is more transparent here than assigning an arbitrary yearly percentage gain. CoinGecko lists a total supply of one billion ZFORGE but doesn't report circulating supply. For the calculations below, one billion $ZFORGE is assumed as circulating supply. These are scenario illustrations, not guaranteed targets.
Year | Bear Case | Base Case | Bull Case | Main Driver |
2027 | $0.010 | $0.035 | $0.070 | Adoption/liquidity |
2028 | $0.008 | $0.050 | $0.100 | Ecosystem growth |
2029 | $0.006 | $0.070 | $0.150 | Market cycle |
2030 | $0.005 | $0.100 | $0.220 | Long-term adoption |
Token price equals market cap divided by circulating supply. With one billion ZFORGE assumed circulating, a $1 million market cap divided by one billion tokens works out to $0.001 per ZFORGE. Scale that up or down, and the rest of the table follows the same logic, which is worth keeping in mind while scanning any long-term forecast coverage for newer tokens generally.
Market Cap | Implied ZFORGE Price |
$5M | $0.005 |
$10M | $0.01 |
$35M | $0.035 |
$50M | $0.05 |
$70M | $0.07 |
$100M | $0.10 |
$150M | $0.15 |
$220M | $0.22 |
ZFORGE Price Prediction 2027
For the bear case, a $0.010 price implies approximately a $10 million market cap: $10,000,000 divided by 1,000,000,000 tokens equals $0.010. The base case assumes the token reaches a $35 million valuation, since $35M divided by 1B works out to $0.035.
The bull case requires a $70 million valuation, or $70M divided by 1B, landing at $0.070.
The key variable here is whether ZFORGE develops deeper liquidity and sustained demand, rather than relying only on early speculative trading. That's the same variable broader exchange listing tracking tends to flag for any token still this early in its life.
ZFORGE Price Prediction 2028
The 2028 scenarios assume a wider valuation range as the project potentially develops greater market participation. A $0.008 bear-case price corresponds to $0.008 multiplied by 1B, or an $8 million market cap.
The $0.050 base case corresponds to $0.050 times 1B, roughly a $50M market cap. The $0.100 bull case requires $0.100 times 1B, or a $100M market cap. The important point: reaching $0.100 wouldn't simply require a percentage increase from today's price. It would require the token's implied valuation to climb to roughly $100 million under the one-billion-token assumption, which is a very different bar to clear.
ZFORGE Price Prediction 2029
For 2029, the model widens the valuation range rather than assuming a fixed annual return. The $0.006 bear case equals a $6 million market cap. The $0.070 base case equals $0.070 times 1B, or $70M. The $0.150 bull case equals $0.150 times 1B, or $150M.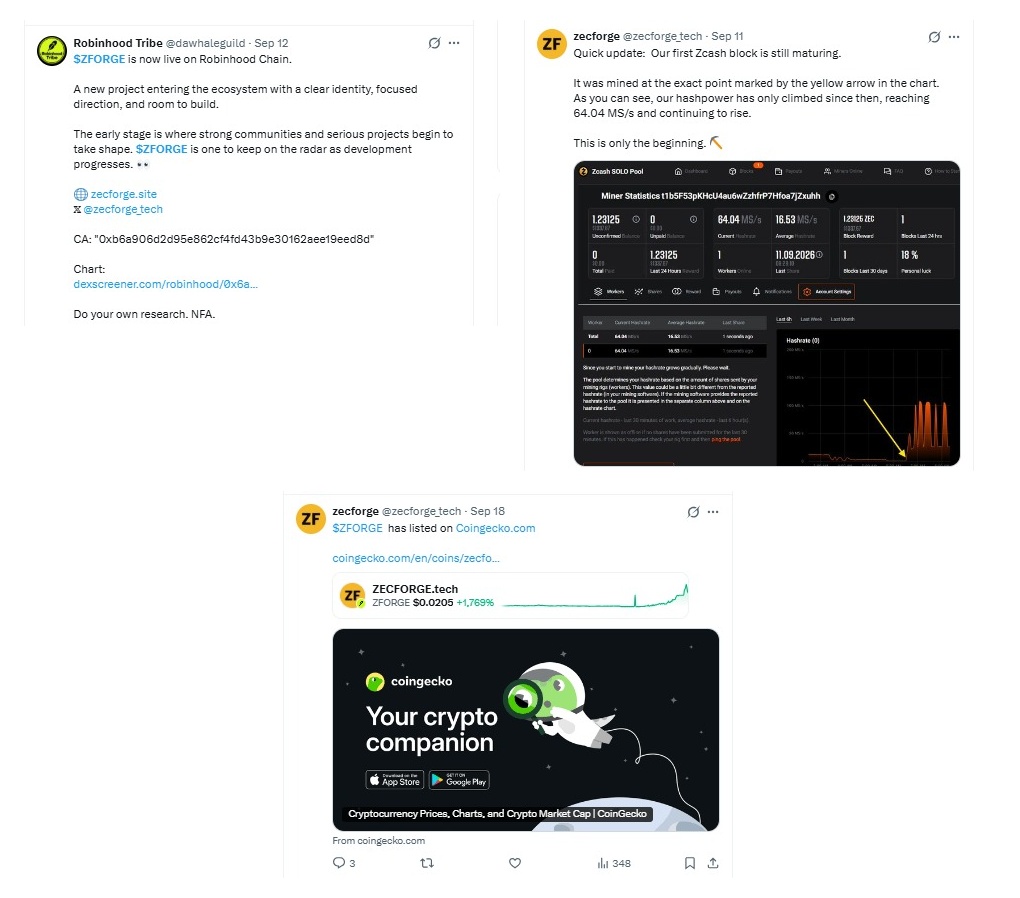
This scenario leans on stronger liquidity, broader market participation, and continued interest in the project's mining claims, where ZECFORGE describes itself as a fee-funded Zcash mining and token-buyback project. Activity around that mechanism, plus any airdrop or incentive programs that surface along the way, could become factors worth monitoring.
ZFORGE Price Prediction 2030
The model becomes particularly dependent on assumptions about adoption and market size. The $0.005 bear case represents $0.005 times 1B, or a $5 million market cap. The $0.100 base case represents $0.100 times 1B, or $100M. The $0.220 bull case requires $0.220 times 1B, or $220M.
Therefore, a $0.220 ZFORGE price shouldn't be read as simply a fixed multiple from today's price.
The more useful question is whether a $220 million valuation could be supported by actual liquidity, trading activity, adoption, and sustained demand, something ongoing crypto-news coverage tends to track more reliably than a single price target ever could.
Supply caveat
These calculations assume one billion circulating tokens. If the actual circulating supply differs, the implied price changes with it. For example, at a $10 million market cap, one billion circulating implies $0.01, five hundred million circulating implies $0.02, and two hundred fifty million circulating implies $0.04.
That's why any long-term forecast for $ZFORGE should show its supply assumption next to it, rather than presenting a bare number on its own. CoinGecko currently reports circulating supply as unavailable while listing total supply at one billion, so this distinction matters more for ZFORGE than for most established tokens.
What Could Drive $ZFORGE Price Higher?
Zcash/Equihash Activity
The project claims it rents Equihash hash power to mine Zcash blocks, with hash power reported at 64.04 MS/s and climbing as of an early update. If that output scales, it gives the token a narrative beyond pure speculation.
$ZFORGE Buyback Mechanism
The project describes converting mined proceeds into ETH, then using that ETH to buy back $ZFORGE from the open market. A buyback like that can add steady demand if it holds up under real volume.
Liquidity and Trading Expansion
Deeper markets change how price gets discovered. Right now, a small number of wallets can move the token sharply. More venues would likely smooth that out over time.
What Could Push $ZFORGE Lower?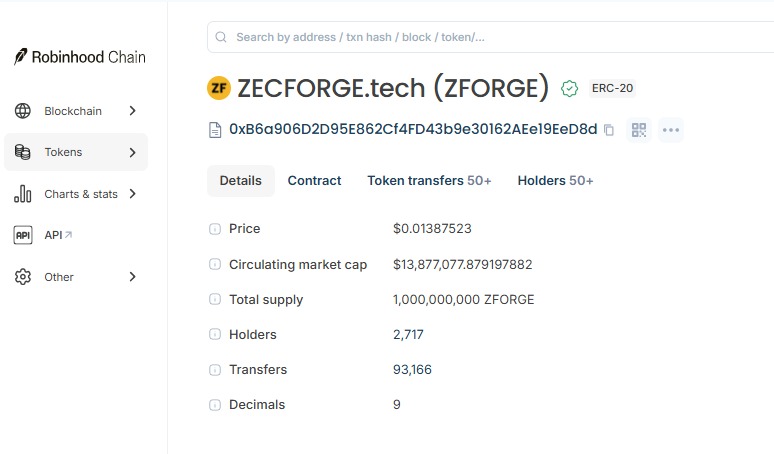
The risk list, plainly:
Trading history spans days, not the months usually needed for reliable technicals.
Liquidity stays thin enough that large sales could move the price hard.
Volatility on the hourly chart already tops 45% in a single session.
The top 10 wallets hold 64.62% of the supply, with the next twenty holding another 9%.
Price discrepancies across trackers point to fragile data coverage.
Execution risk sits with a mechanism untested through a full cycle.
Broader crypto-market weakness would likely hit a token this new hardest.
That holder concentration figure deserves its own line. When ten wallets control nearly two-thirds of supply, one exit can outweigh days of organic buying. Noted.
$ZFORGE Bull, Base, and Bear Scenarios
Bull case: sustained volume, wider exchange coverage, and visible buyback activity push valuation toward the higher end of each yearly range.
Base case: the token settles into a wide range as speculative interest cools but doesn't vanish, with holder concentration easing gradually rather than through a sudden dump.
Bear case: thin liquidity and fading attention drag price back toward levels seen just after launch, with a breakdown marked by a sustained drop below the recorded all-time low.
Invalidation: every scenario above stops applying if the mining or buyback mechanism stops functioning or if the token loses its main trading venue. Likely within twelve months? Hard to call this early.
Turns out, what happens next comes down to whether $ZFORGE keeps a working mechanism and real liquidity, not to chart patterns alone. And given the holder concentration and short trading history, a cautious, bearish-leaning stance on near-term stability looks more reasonable than a confidently bullish one. Readers tracking related updates can follow the crypto news feed and the listing calendar.
Disclaimer
This article is for informational purposes only and isn't financial, investment, or trading advice. $ZFORGE is an extremely new token with limited trading history, thin liquidity, and concentrated holder distribution. All scenarios, targets, and market-cap assumptions above are illustrative, not guarantees. Cryptocurrency markets carry a high risk of loss, and independent research or advice from a qualified professional is recommended before any investment decision.


















