ALLINU Price Prediction 2026-2030: What Could Drive ALLINU Higher?


Some coins move quietly. This one didn't.
A double-digit swing and a brand-new all-time high have traders asking one question right now.
ALLINU price prediction chatter is spiking after a wild Solana meme-token rally. So where does it go from here?
Quick Prediction Box
Metric | Value |
Current Price | $0.0206 |
24H Change | +53.0% |
Market Cap | ~$20.7M |
Volume (24H) | ~$5.7M |
Trend | Range-bound after a sharp spike |
RSI (14) | 51.82 (neutral) |
Support | $0.0185, secondary $0.0129 |
Resistance | $0.0277-$0.0283 |
Next Target | $0.0305 |
Bull Case | $0.035 - $0.042 |
Base Case | $0.022 - $0.028 |
Bear Case | $0.013 - $0.017 |
Invalidation | Close below $0.0129 |
Data snapshot: September 21, 2026, 09:19 UTC. Figures move fast on low-cap tokens; treat this as a point-in-time reference, not a live feed.
ALLINU Price Prediction: What Matters Right Now
The short answer traders want first: $ALLINU is trading near $0.0206, up sharply on the day, and still inside the range it carved out since launch.
That's the immediate picture. The longer answer needs the trend, the volume, and the levels underneath it, and that's what the next two sections unpack.
ALLINU Current Price and Market Snapshot
$ALLINU last changed hands around $0.0206, according to live coin data, with a market cap near $20.7 million against a circulating supply of roughly 997 million tokens.
Trading volume over 24 hours sits close to $5.7 million, which is a meaningful ratio against market cap for a token this size. That ratio matters more than the raw price. It's a rough proxy for how easily large orders move the chart without warning.
ALLINU Technical Analysis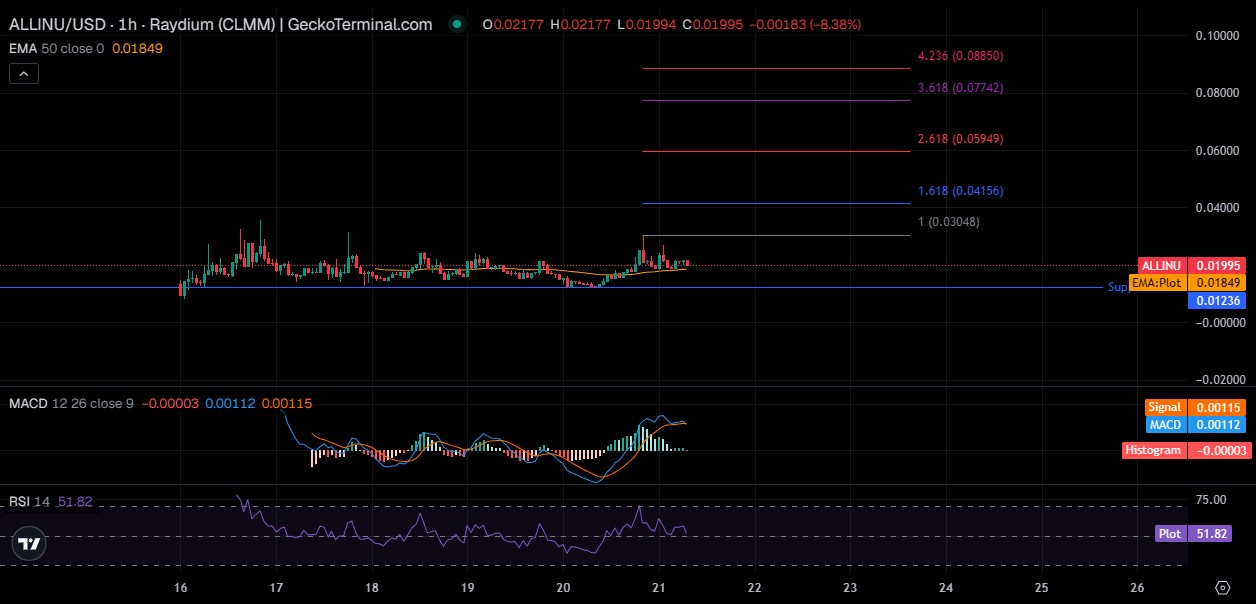
$ALLINU Trend, RSI, and Trading Volume
On the hourly chart tracked via pool-level trading data, RSI sits at 51.82. Neither overbought nor oversold. Right in the middle, which usually means the market is undecided rather than exhausted.
MACD is flattening near the signal line after a brief bullish cross, and trading is hugging its 50-period EMA near $0.0185. That EMA has acted as dynamic support more than once already.
ALLINU Price Prediction for 2026
Near-term forecasting on a token this young leans heavily on the levels already printed, because there isn't much history to build patterns from yet.
ALLINU Short-Term Forecast
Over the next 24 hours, expect a chop between $0.0185 and $0.0283, unless volume breaks the pattern. Across three to seven days, a hold above the EMA opens a retest of the recent high near $0.0283. Stretched to two to four weeks, the token either builds a higher base above $0.02 or it slides back toward its all-time low.
ALLINU Bull, Base, and Bear Scenarios
Bull case: a push through $0.0283 targets the $0.035-$0.042 zone, aligned with the 1.618 Fibonacci extension near $0.0416.
Base case: sideways drift between $0.022 and $0.028 while the market builds volume.
Bear case: a break below $0.0185 opens $0.013-$0.017, close to the all-time low. Each of these is a scenario, not a promise. Worth repeating.
ALLINU Price Prediction 2027-2030
Longer horizons on a meme token require translating a price target into a market cap number, then asking what growth that number implies. Supply stays roughly fixed near 997 million tokens, so price and market cap move together.
ALLINU Price Prediction 2027
A $0.03-$0.06 range implies a market cap of roughly $30M-$60M, meaning growth of 45% to 190% from current levels.
That kind of move typically needs sustained volume, a widening holder base, and continued exchange access, including the kind of exchange listing momentum already visible in its first two weeks.
ALLINU Price Prediction 2028
A $0.05-$0.09 range implies roughly $50M-$90M in market cap, a jump that would need real ecosystem activity behind it rather than pure speculation, plus visibility through token distribution events that widen the holder base beyond current whale concentration.
ALLINU Price Prediction 2029
A $0.07-$0.13 range implies roughly $70M-$130M in market cap. That level would put the token among more established mid-cap meme names, assuming broader market conditions stay supportive and liquidity keeps deepening rather than thinning out.
ALLINU Price Prediction 2030
A $0.10-$0.20 range implies roughly $100M-$200M in market cap, a five-to-ten-times move from today.
Reaching $0.05 alone would require close to $49.85M in market cap; reaching $0.10 would require close to $99.7M. Big numbers. Bigger assumptions behind them.
ALLINU Support and Resistance Levels
Key Support Levels
Primary support sits at the 50-period EMA near $0.0185. Secondary support sits at $0.0129, the token's all-time low, hit less than a day before this snapshot. A break of that floor would be a serious technical warning, and it's worth checking a coin events calendar for anything scheduled that could accelerate a move either way.
Key Resistance Levels
Immediate resistance sits at $0.0277-$0.0283, the recent local high. Above that, the 1.0 Fibonacci extension near $0.0305 becomes the next real test.
Breakout and Breakdown Levels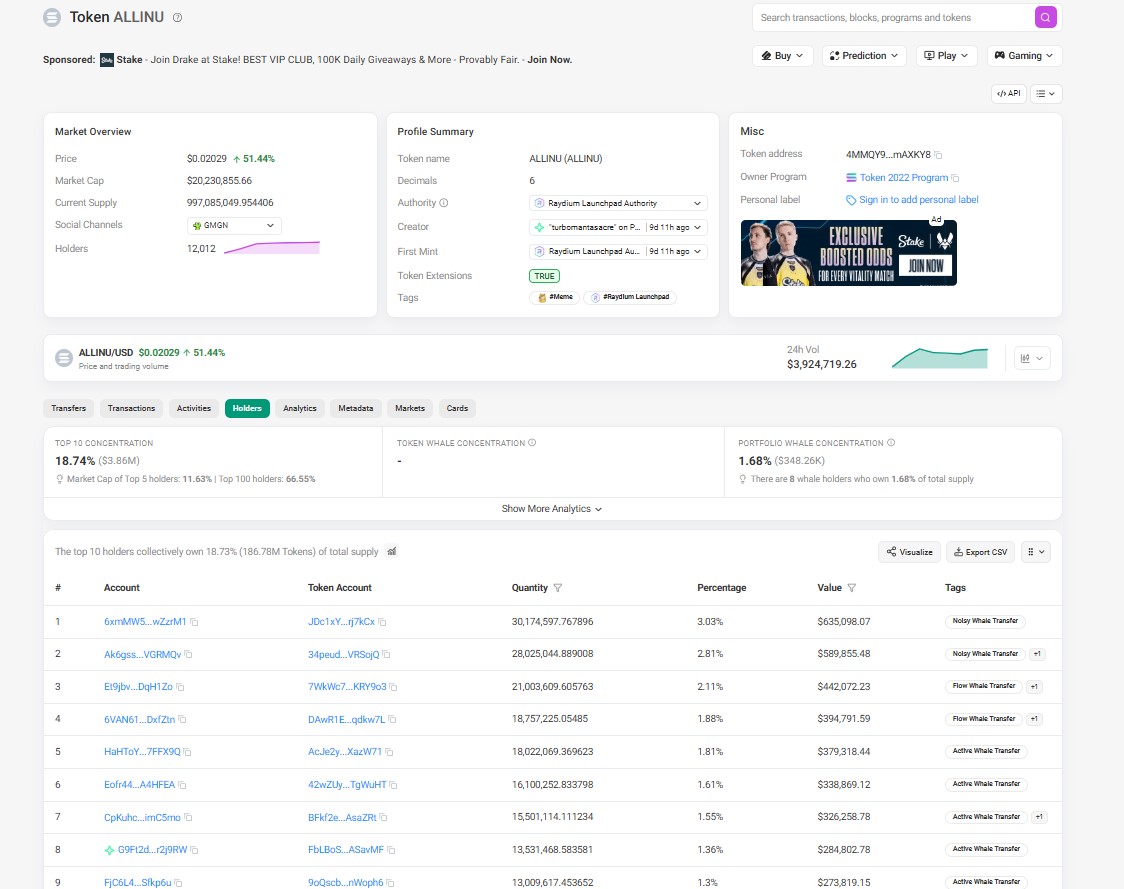
A trading close above $0.0283 on rising volume would likely open a run toward $0.0416. On the other side, a close below $0.0129 breaks the token's entire post-launch range.
Holder data from on-chain tracking shows the top ten wallets control under nineteen percent of supply, which limits (but doesn't remove) single-wallet breakdown risk.
What Could Drive ALLINU Higher?
Rising trading volume alongside rising price would be the cleanest bullish signal. Deeper liquidity on Raydium reduces slippage and attracts larger orders. 
New listings help too, and the futures listing flagged in recent exchange activity already added leverage and visibility within the first week. Growing ecosystem activity, social attention, and a firm Bitcoin trend would all add fuel. Project development news could shift sentiment fast, for better or worse.
What Could Push ALLINU Lower?
Loss of the $0.0185 support would be the first warning sign. Falling volume into a rising price is a classic warning too, often called a bearish divergence.
Liquidity weakness on a single-DEX token amplifies every large sell order. Whale wallets selling into strength could cap upside quickly, especially with top-holder concentration still notable. A broader market correction, a failed breakout at resistance, or supply-related surprises could all invalidate the bullish case fast.
ALLINU Price Prediction Methodology
These projections combine chart-based technical analysis, current market cap, circulating supply, and a scenario framework tied to broader market conditions.
Bull, base, and bear ranges get built from Fibonacci extensions, moving averages, and historical volatility, then cross-checked against what market cap growth each target would actually require.
Analysis draws on aggregated market and on-chain data rather than a single automated model; a broader breakdown of that approach sits within ongoing crypto market coverage. None of this removes uncertainty. It just narrows it.
Disclaimer
This content is for informational purposes only and does not constitute financial, investment, or trading advice. Cryptocurrency markets, especially newly launched, low-market-cap tokens, are highly volatile and carry substantial risk, including total loss of capital.
Price scenarios described here are technical projections based on available data at the time of writing and are not guarantees of future performance. Independent research and professional consultation are recommended before making any financial decisions.


















