Silver Price Forecast: Can SXAG Reach $140 by 2030? Explained


Silver price forecast (XAG) traders are watching a coil that has to break soon, one way or the other. Price has been squeezing into a shrinking range for days, and the kind of structure showing up on the chart right now rarely stays quiet for long. No personal position is held here; this is a straight read of the chart and the numbers below.
Silver Price Today: Live Data and Market Snapshot
Silver (XAG) is priced at $66.26, down 0.28% over the last 24 hours. Market cap on this tracked instrument stands at $265.07B, while fully diluted valuation runs far higher at $3.71T, a gap driven by a 56B total supply against a much smaller self-reported circulating supply of 4B XAG.
24h volume is reported flat at $0 on this feed, so spot traders should cross-check liquidity on their own exchange before treating this purely as a volume signal. (Source: market data snapshot, Sep 21, 2026)
Silver News Today: A Wave Count Says Not Done Yet
The Silver latest news worth flagging today is less a headline and more a warning from the charts themselves. 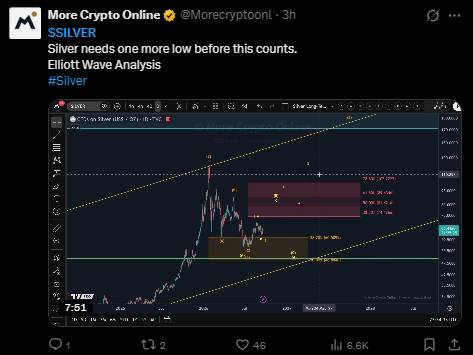
More Crypto Online posted an Elliott Wave read on XAG suggesting silver needs one more low before the current wave count is considered complete.
That kind of call lines up neatly with what the 1h chart is already showing, a market compressing into a wedge rather than confidently choosing a direction, which is exactly the setup that tends to precede a sharp move once it resolves. (Source: X post by More Crypto Online, Sep 2026)
Quick Take
CMP: $66.338 (1h chart)
Trigger level: close above $67.182 confirms bullish continuation
Failure level: close below $65.366 confirms bearish breakdown
Structure: price trading inside a falling wedge
Data timestamp: Sep 21, 2026, 1h FXCM chart
Silver Price Prediction 2026 Technical Analysis
On the 1h FXCM chart, silver is currently trading inside a falling wedge, a pattern formed by a series of lower highs and lower lows that keep converging into a tighter and tighter range. 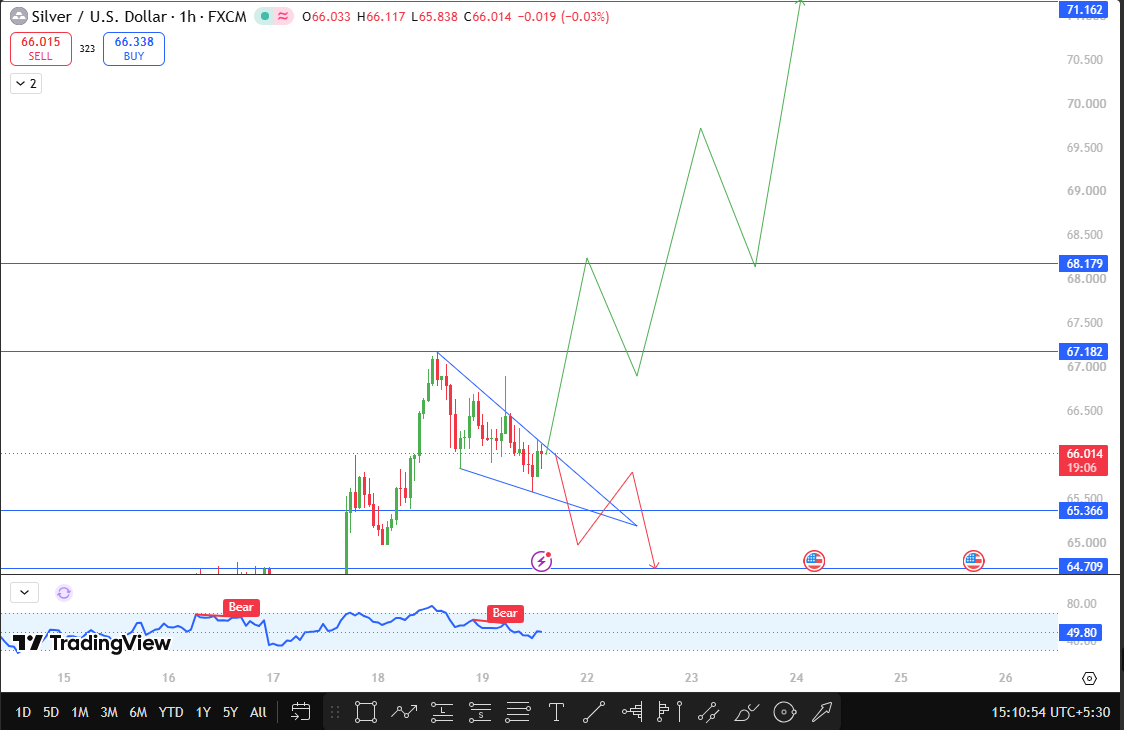
Wedges like this are typically continuation-or-reversal patterns depending on which side breaks first, and right now price is sitting close to the middle of it, which keeps this Silver technical analysis genuinely two-sided for the moment.
A confirmed 1-hour close above $67.182 would mark a break of the wedge's upper boundary and open the path toward $68.179 first.
If that level gives way too, the next stop on this XAG price prediction is $71.162, a level that would represent a clear breakout from the current compression rather than just a minor bounce.
On the other side, a close below $65.366 would confirm the wedge is resolving lower instead, and that lines up with the Elliott Wave view calling for one more low.
In that case, $64.709 becomes the level to watch as the next area where buyers would likely look to step back in.
The RSI on this chart has printed two separate bear tags through the recent decline and currently sits near 50, sitting right at the fence, much like the price itself. That kind of indecision is common right before a wedge finally breaks.
Support and Resistance Levels to Watch
Level | Price | Distance From CMP |
Resistance 3 | $71.162 | 7.27% above |
Resistance 2 | $68.179 | 2.78% above |
Resistance 1 (wedge top) | $67.182 | 1.27% above |
CMP | $66.338 | — |
Support 1 (wedge bottom) | $65.366 | 1.47% below |
Support 2 | $64.709 | 2.46% below |
Bull Case, Base Case, And Bear Case For Silver (XAG)
In the bull case, silver breaks and closes above $67.182, invalidating the case for one more low, and momentum carries the price toward $68.179 and then $71.162. This scenario would effectively override the current bearish wave count.
In the base case, XAG keeps coiling inside the wedge for a while longer, testing both boundaries without committing.
A XAG price outlook built around this range would treat $67.182 and $65.366 as the two lines that actually matter until one gives way.
In the bear case, silver closes below $65.366, confirming the one-more-low scenario from the wave count, and the price slides toward $64.709. Given how tight this wedge has become, a break in either direction could move quickly once it finally happens.
Silver Price Prediction 2030
The number that stands out most for XAG in the longer term is not the spot price; it is the gap between its $265B market cap and its $3.71T fully diluted valuation.
With a 56B total supply against a self-reported circulating figure of just 4B, most of silver's theoretical supply has not even entered the market yet, which means the long-term path depends heavily on how that supply gets released rather than on demand alone.
If issuance stays measured and industrial and monetary demand for silver keeps its historical pace, a reasonable 2030 range for XAG sits somewhere between $90 and $140, but that supply overhang is the one variable capable of capping upside regardless of how strong demand gets.
Risks To Watch
The large gap between circulating and total supply is a genuine overhang risk if more tokens enter circulation faster than demand can absorb them.
The $0 reported 24h volume on this feed also means liquidity should be verified independently before trading off it.
Every level in this Silver price forecast should be treated as conditional on an actual close, not a brief wick through the line.
Glossary
Falling Wedge: A chart pattern of converging lower highs and lower lows that typically resolves with a breakout in either direction.
Break And Close: A price move that closes beyond a level on the relevant timeframe, rather than just wicking through it.
Fully Diluted Valuation (FDV): The theoretical market cap if all tokens in the total supply were in circulation.
CMP: Current market price, taken directly from the live chart.
Disclaimer
This article is for informational purposes only and does not constitute financial advice. Markets are volatile, and readers should do their own research before making any investment decisions.