BENQI Price Prediction 2026-2030: $QI Forecast and Risks

BENQI Price Prediction Today
A BENQI price prediction needs real numbers before anything else, and this one starts with a proper price prediction framework rather than a guess. QI trades near $0.002780 right now, up 90.11% on the day. That's not a small move. CoinMarketCap puts the market cap at roughly $20.04 million, with 24H volume near $17.94 million.
Volume to market cap sits at 87.02%. That ratio's unusually high.
It tells us trading activity today nearly matches the entire market cap. Something triggered heavy buying, and the chart backs that up with a sharp green candle breaking out of a long base.
Quick Prediction Box
Data snapshot as of 2026-09-25, 14:25 UTC
Metric | BENQI (QI) |
Current Price | $0.002780 |
24H Change | +90.11% |
Trend | Bullish (short term), overheated |
Immediate Support | $0.000994 - $0.001008 |
Key Resistance | $0.003567 |
RSI (14, Daily) | 88.75 |
MACD | Bullish crossover, rising histogram |
Next Target | $0.003567, then $0.004928 - $0.005101 |
Bull Case | $0.005101 - $0.007674 |
Base Case | $0.0018 - $0.0030 |
Bear Case | $0.0010 - $0.0015 |
Invalidation | Trades sustained below $0.000994 |
What Could Drive BENQI Price?
BENQI Fundamentals
BENQI runs lending and borrowing markets on Avalanche, and QI is its governance and incentive token. Circulating supply sits near 7.2 billion QI out of a 7.2 billion total supply, fully unlocked, having passed through seed, private, and public sale rounds typical of a presale to IEO funding path.
Avalanche Ecosystem Activity
QI's fortunes track Avalanche DeFi activity closely. More borrowing demand on Avalanche generally means more real yield flowing through BENQI's markets, alongside incentive programs similar to what shows up on crypto airdrops trackers.
Bitcoin Correlation
Small-cap DeFi tokens like QI tend to amplify Bitcoin's broader moves. A weak Bitcoin market makes every bull case here harder to sustain.
News and Project Catalysts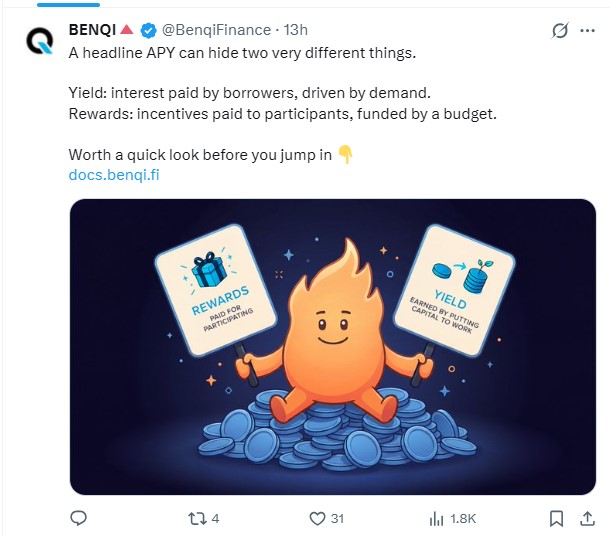
BENQI's official account recently distinguished between protocol yield, paid by borrowers, and reward incentives, funded by budget, urging users to check the difference before depositing.
Separately, the project highlighted tokenized real-world assets settling on Avalanche through BENQI's infrastructure. Both are confirmed project communications, not rumors, the kind worth tracking through a dedicated crypto news feed. Speculative catalysts, like fresh exchange listings, remain unconfirmed for now.
BENQI Technical Analysis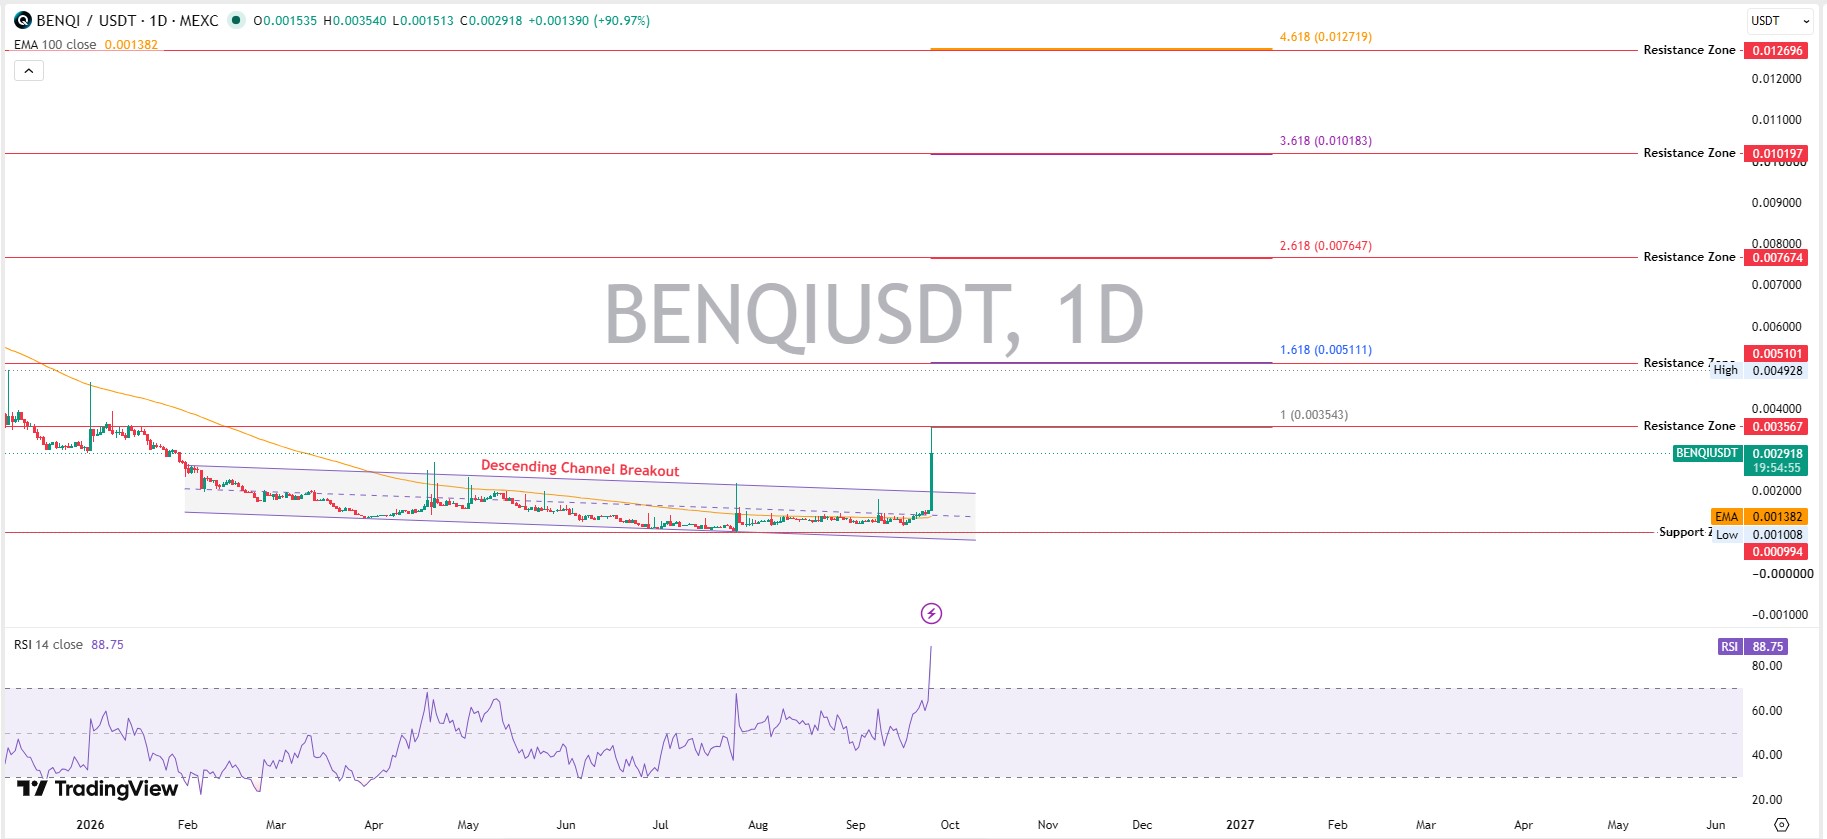
QI Support Levels
The tightest support sits between $0.000994 and $0.001008, marked directly on the daily chart as the channel's lower boundary. That's where sellers ran out of supply for months.
A break below that zone would erase the entire 2026 basing structure. That's a big deal.
QI Resistance Levels
Layered resistance runs from $0.003567 up through $0.004928-$0.005101, then $0.007674 and $0.010197. Each level lines up with a Fibonacci extension drawn off the prior range.
These zones matter because they mark where past supply clusters sit. Sellers parked orders there before, and they likely will again.
RSI and Momentum
RSI on the daily chart reads 88.75. That's extreme, deep into overbought territory most traders treat as a warning, not a green light.
When we pulled up the RSI chart, the spike stood out immediately against months of readings stuck between 30 and 60. No prior divergence signals show up yet, momentum simply accelerated in one session.
MACD Signal
MACD sits at 0.000169, above the signal line at 0.000053. The histogram reads 0.000116 and expands.
That's a textbook-style bullish crossover, minus the false starts seen earlier in the year. Confirmation would need the histogram to keep growing over the next few sessions, not just one green bar.
Volume Analysis
Volume expanded sharply alongside the breakout candle, visible as a tall spike on the chart's volume histogram. Without that surge, the breakout would carry far less weight.
But one volume spike isn't a trend. Follow-through volume over the next several days decides whether this holds.
BENQI Price Prediction for 2026
QI spent most of 2026 stuck in a falling channel, grinding sideways with lower highs, a pattern visible on the live TradingView chart. That channel just broke. But one breakout day doesn't confirm a trend; it confirms attention.
QI Bull Case for 2026
The bull case needs trades to hold above $0.003567 on a daily basis. Volume has to stay elevated, not fade back to the quiet levels seen through most of the year.
If that holds, the 1.618 Fibonacci extension near $0.005101 becomes the next magnet. And a retest of that broken channel top as support would strengthen it further, especially if it lines up with a listed date on the coin events calendar.
QI Base Case for 2026
Here's the thing: most breakouts after a 90% daily spike cool off first. A base case has QI drifting between $0.0018 and $0.0030 for weeks. Consolidation, not collapse.
This range lets the market digest the move. Traders who bought the pump exit, and new buyers absorb supply.
QI Bear Case for 2026
If trades slip back under the old channel resistance near $0.0018, the bear case opens up fast. Bulls would lose the narrative quickly.
Downside sit near $0.0013, then the $0.0010 support zone. A close string of red daily candles under momentum divergence would confirm this path.
BENQI Price Prediction 2027-2030
Long-range figures on a micro-cap token carry wide error bars. Treat these as conditional scenarios, not promises, tied to the supply schedule laid out in BENQI's token distribution documentation.
Year | Bear | Base | Bull | Expected Market Cap (Base) | Main Driver |
2027 | $0.0006 | $0.0035 | $0.0090 | ~$25.2M | Avalanche DeFi growth, lending demand |
2028 | $0.0005 | $0.0055 | $0.0140 | ~$39.6M | Altcoin cycle, RWA adoption on Avalanche |
2029 | $0.0004 | $0.0070 | $0.0190 | ~$50.4M | Protocol revenue, new listings |
2030 | $0.0004 | $0.0090 | $0.0260 | ~$64.8M | Market maturity, institutional DeFi flows |
Expected market cap uses base-case price times the 7.2 billion QI circulating supply, held flat since supply is already fully unlocked.
BENQI Breakout or Breakdown Setup
What Confirms a QI Breakout?
A daily close, meaning trades settling the session, above $0.003567 is step one. Volume expansion alongside it is step two.
RSI needs to cool from 88 without collapsing, and a retest of $0.003567 as new support has to hold. Four conditions, not one. A confirmed breakout also tends to show up quickly on exchange listing trackers as fresh venues pick up the pair.
What Would Invalidate the Bullish Setup?
Trades falling back under $0.001008, the descending channel's old resistance turned support, invalidates the entire structure. That would suggest the breakout was a trap, not a trend.
What Could Trigger a Breakdown?
A breakdown needs the $0.000994 support zone to fail on rising volume. Thin volume failures often reverse. Heavy volume failures usually don't.
BENQI Risks to Watch
Liquidity stays thin against today's move, raising slippage risk. Volatility is severe, going up 90% in a day and down just as fast. Broader market weakness would drag QI down regardless.
Avalanche ecosystem risk applies too, since usage depends on one chain. Technical breakdown risk sits right below trades, at $0.000994.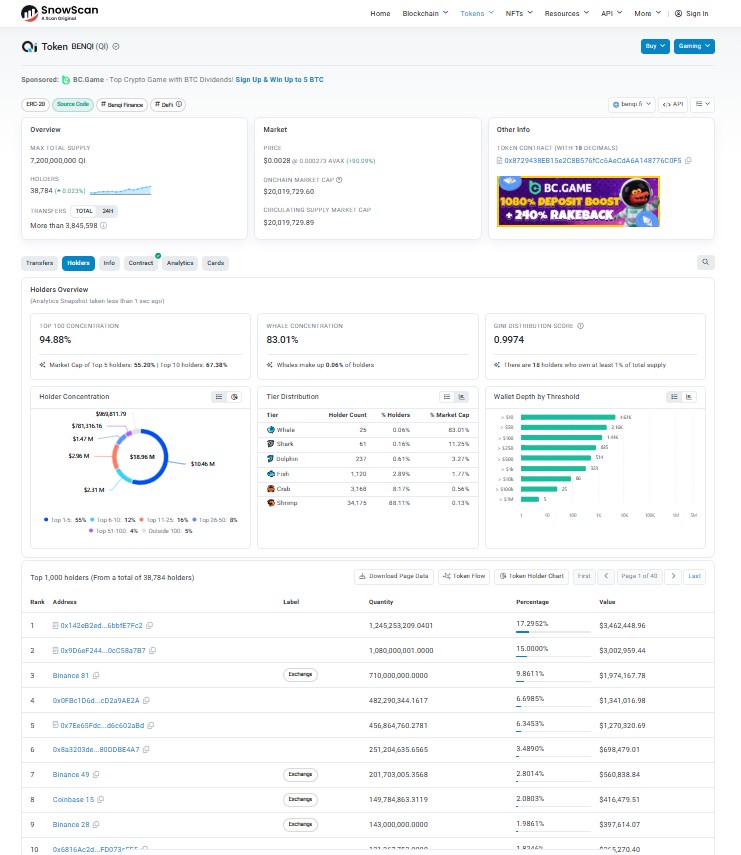
Concentration risk is real. SnowScan shows top 100 holders control 94.88% of supply, whale wallets alone hold 83.01%, and the Gini score reads 0.9974. Regulatory risk around DeFi lending hasn't gone away either.
Can BENQI Reach $0.01?
Required market cap equals target price multiplied by circulating supply. At $0.01 and 7.2 billion QI circulating, that's a $72 million market cap.
The current market cap sits near $20.04 million. Reaching $72 million needs roughly 259% growth from here.
That's not impossible for a micro-cap during an altcoin rally. But it would require sustained volume, not one spike day, and broader Avalanche DeFi momentum behind it.
Trader Takeaway
Above $0.003567, the bullish structure improves, and the next resistance band comes into focus.
Between $0.0018 and $0.0030, expect range-bound consolidation while the market decides.
Below $0.001008, the bearish invalidation case takes over, and the breakout narrative weakens fast.
Watch volume, watch RSI cooling, and watch how trades react at $0.003567 on the next test.
Disclaimer
This article is for informational purposes only and does not constitute financial, investment, or trading advice. Cryptocurrency markets, including tokens like BENQI (QI), are highly volatile and carry substantial risk of loss. Price predictions and scenario ranges are speculative and based on technical patterns and available market data; they are not guarantees of future performance. Independent research and consultation with a qualified financial advisor is strongly recommended before making any investment decisions.

















