Bitcoin Holds Key Level for 45 Weeks, BTC Eyes $82,800 Now: What Next?


Bitcoin price today sits near $81,600, up about 1.45%. The move comes after BTC closed last week above its 50-week moving average for the first time in 45 weeks. This BTC news has traders asking if the bear phase is over.
What Is the Bitcoin Price Today?
BTC traded at $81,681.9 during Asian morning hours on Monday, gaining $1,167.46 on the day. The weekly chart shows an open of $81,152, a high of $82,062, and a close of $81,612.
Market cap stands near $1.63 trillion. Open interest sits at $56.37 billion, up 1.77%. Spot volume came in at $2.84 billion, while futures volume reached $53.40 billion.
Why Is BTC Price Going Up Today?
BTC closed the week ended September 20 above its 50-week moving average for the first time in 45 weeks. Traders often watch this line as a signal for the end of a longer downtrend.
The 50-week EMA sits near $77,676, while RSI reads near 59.13, not overbought, leaving room for more upside before momentum stretches.
Analyst Ted Pillows called this week's close the most important test. He said a weekly close above the 50-week MA would strengthen the case for a cycle bottom.
Gains followed a hawkish Federal Reserve meeting and a Senate setback for the CLARITY Act. Even so, spot ETF demand held up, with US funds closing the week with a small net inflow of $6.2 million.
Are BTC Whales Buying or Selling Right Now?
On-chain data shared by Crypto Rover shows long-term holder supply climbing toward levels not seen before. The chart tracks coins held by wallets that have not moved in a long stretch, and that supply kept rising through 2026 even as price recovered.
This kind of accumulation often points to reduced selling pressure, though it does not guarantee future direction.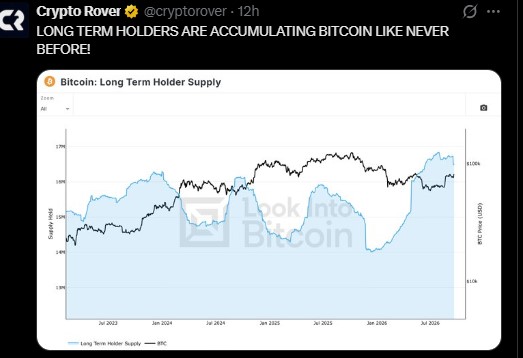
Is Michael Saylor Buying More BTC?
Michael Saylor, founder of Strategy, posted an update captioned "A little more orange." The chart shows holdings valued near $67.90 billion, built from 114 purchases at an average cost of $75,412 per coin, for a roughly 6.58% unrealized gain.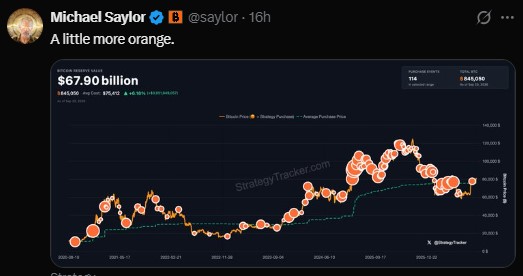
What Is the Next BTC Price Target?
Level Type | Price Zone | Notes |
Resistance 1 | $82,800 | Weekly rejection zone since earlier this year |
Resistance 2 | $88,000–$92,000 | Next target on a confirmed breakout |
Resistance 3 | $96,000–$100,000 | Longer-term upside zone |
Support 1 | $77,676 | 50-week EMA |
Support 2 | $72,000–$68,000 | Prior demand zone |
Support 3 | $58,000 | Prior swing low area |
BTC gained close to 4.85% over the past week and is up 29.70% over the last 35 days. The weekly candle pushed above the 50-week average rather than only testing it, a firmer signal to some traders.
Will Bitcoin Go Up or Down From Here?
A weekly close above $82,800 could open the door toward $88,000 to $92,000, with $96,000 to $100,000 as a further stretch target. This is not a guaranteed outcome, only a possible path based on current chart structure.
A rejection from the $82,270 to $82,800 zone could send price back toward the $77,676 EMA, with a deeper pullback opening the $72,000 to $68,000 region.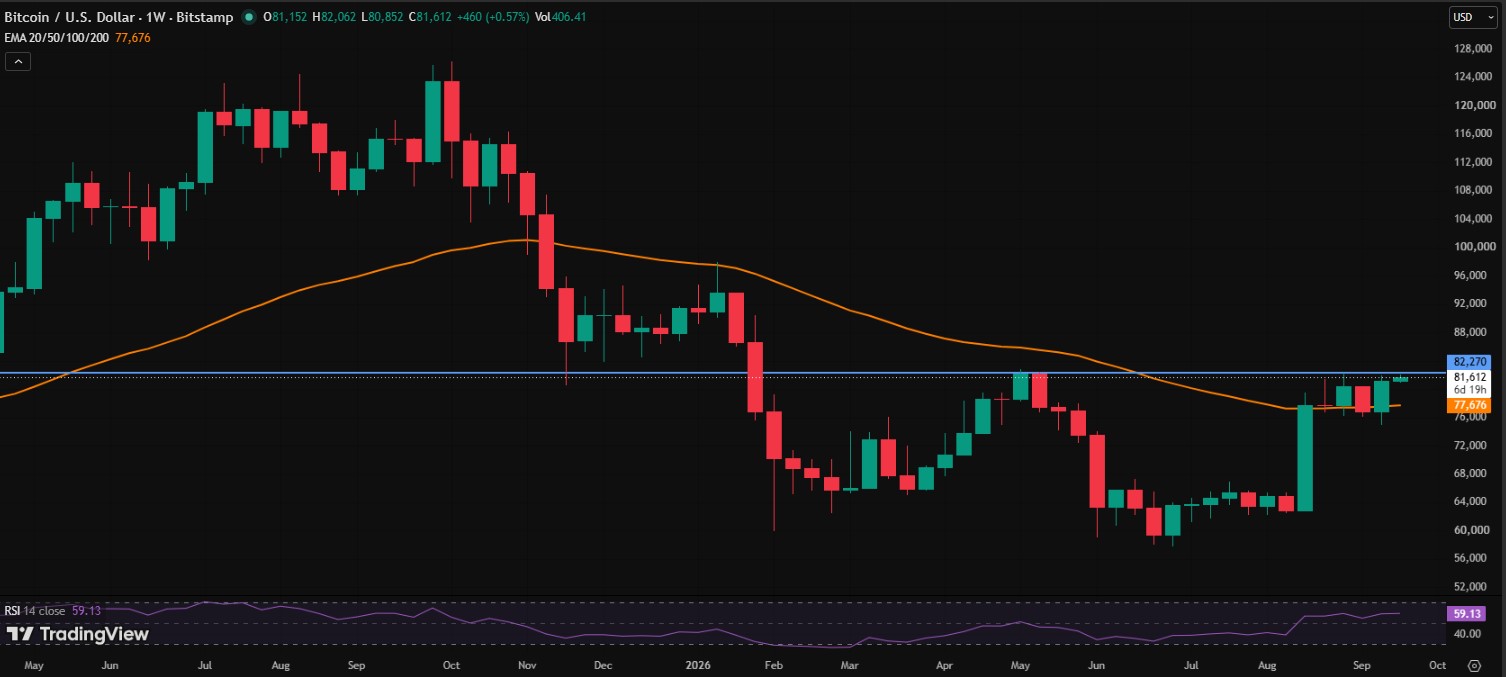
Liquidation data adds context. Over 24 hours, shorts lost $42.90 million versus $12.69 million for longs, out of $55.58 million total, suggesting short sellers got squeezed more in the recent bounce.
Derivatives positioning also leans mildly long. The 24-hour long/short ratio sits at 1.0129, while Binance's top trader position ratio reads 2.1109, well above the account-based ratio of 1.0568, showing larger accounts leaning more bullish than average retail traders.
Is Bitcoin a Good Buy Right Now?
BTC price news this week centers on one thing: whether price can hold above the 50-week average and clear $82,800 on a weekly close. Long-term holder accumulation and steady ETF demand support the bullish case, but a hawkish Fed and stalled crypto legislation remain risks.
Nothing here is a promise of where price goes next. Markets can move against even the clearest chart setups.
Disclaimer: This article is for informational purposes only and does not constitute financial, investment, or trading advice. Cryptocurrency markets are highly volatile, and past performance does not guarantee future results. Always do your own research and consult a licensed financial advisor before making investment decisions.


















