US Oil Price Prediction: Oil Traders Digest Refinery Attack Headlines


WTI crude has pulled back sharply from its recent highs, and the drop has arrived right at a level that has held up every single test since July.
Fresh geopolitical headlines out of the energy sector are adding extra weight to what was already a critical technical juncture.
West Texas Intermediate (WTI), commonly referred to as US Oil, is the primary benchmark for crude oil pricing in North America and one of the most closely watched commodities in global markets.
This US oil price prediction looks at where the price stands today and what the daily chart suggests happens next.
The US oil price today is $94.63 per barrel, down 0.87% on the day. The pullback follows a strong multi-week rally that had pushed crude well above the $95 mark earlier this month.
Live Market Data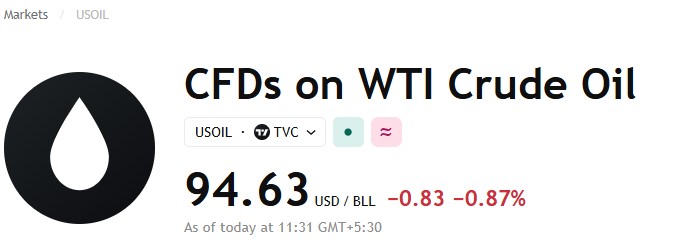
Source: TradingView (USOIL, TVC), as of September 21, 2026, 11:31 UTC+5:30
US Oil News Today
Reports circulating on social media indicate Ukraine carried out one of its largest drone strikes of the conflict, deploying more than 1,600 drones across Russian territory. 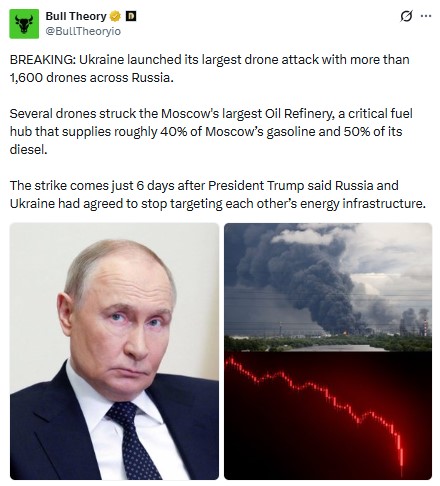
Source: Data Taken From @BullTheoryio, X Account, as of Sep 21, 2026
Several of the drones reportedly hit one of Moscow's largest oil refineries, a facility said to supply roughly 40% of the city's gasoline and half of its diesel.
The strike is being noted as particularly significant because it came just days after reports that Russia and Ukraine had agreed to stop targeting each other's energy infrastructure.
Disruptions to major refining capacity in a key producing region tend to feed directly into crude price volatility, and traders are watching closely to see how supply expectations shift in response.
US Oil Technical Analysis
US oil technical analysis on the daily WTI chart (KCEX, candle closed 11:31 UTC+5:30, September 21, 2026) shows the price inside a rising ascending channel that has guided the trend since early July. 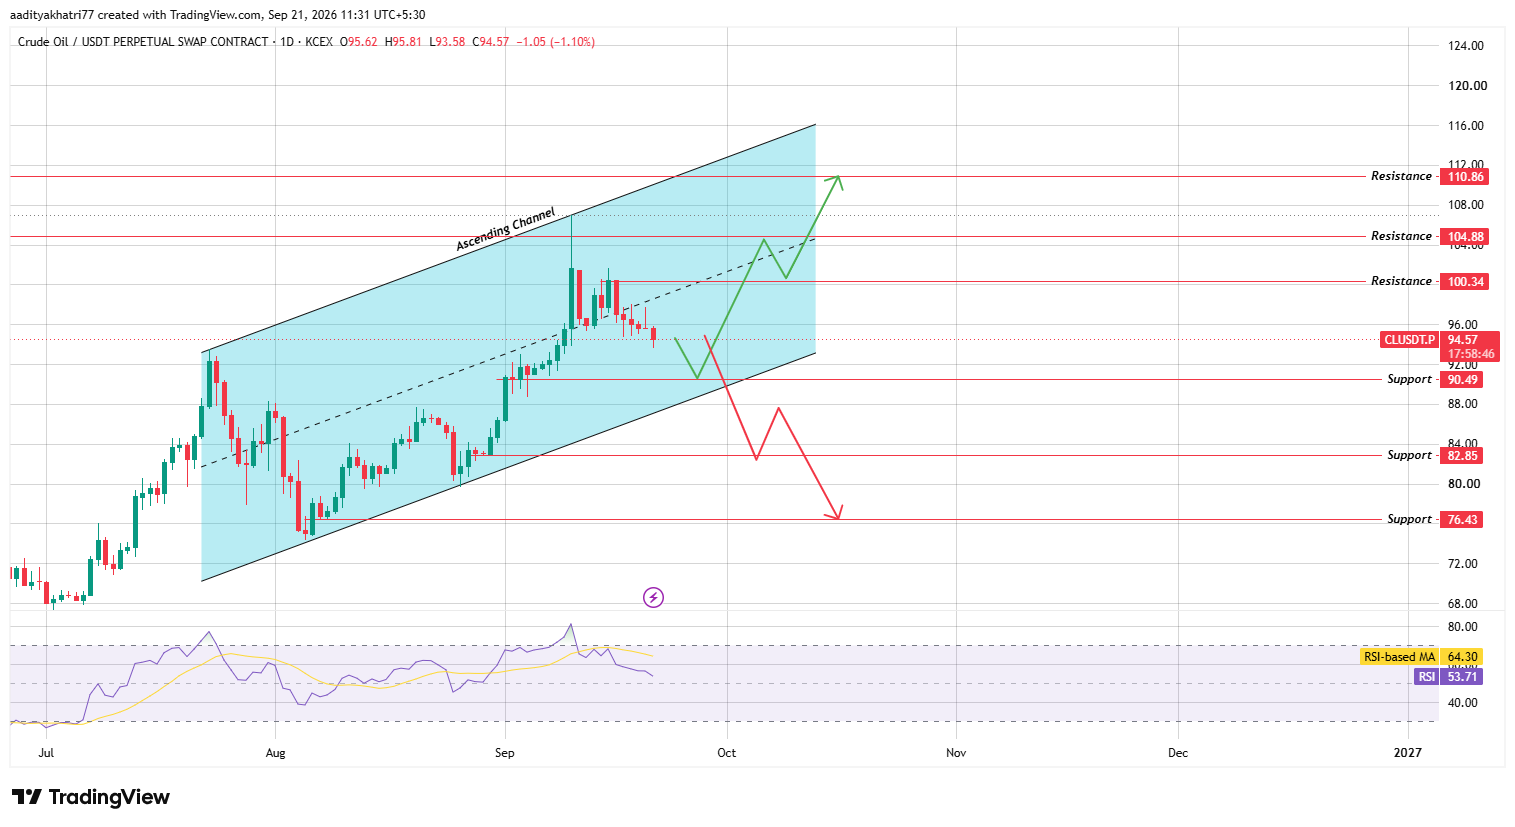
Source: Chart taken from TradingView, as of Sep 21, 2026
The RSI sits at 53.71, below its moving average of 64.30, reflecting cooling momentum as price approaches the lower boundary of the channel.
US Oil Price Prediction: Bullish Case On a Bounce
If WTI tests the lower boundary of the ascending channel and holds, the setup favors a recovery back toward the $100.34 resistance zone first.
A daily close above that level on strong volume would open the path to $104.88, and a confirmed break there puts $110.86 within reach.
This scenario would keep the broader multi-month uptrend intact.
US Oil Price Prediction: Bearish Case on a Breakdown
A daily close below the channel's lower boundary changes the outlook quickly.
The first support to watch is $90.49, and losing that level opens a path toward $82.85.
A sustained breakdown through both levels would put the $76.43 zone in play, unwinding a significant portion of the rally built since July.
Support & Resistance Levels
Support | Resistance |
$90.49 | $100.34 |
$82.85 | $104.88 |
$76.43 | $110.86 |
Bull, Base, and Bear Scenarios
Scenario | Setup | Level |
Bull | Bounce from channel support, daily close above $100.34 | $104.88 – $110.86 |
Base | Price holds near the lower channel boundary and ranges sideways. | $90.49 – $100.34 |
Bear | Daily close below $90.49, channel boundary breaks | $82.85 – $76.43 |
US Oil vs Broader Energy Markets
Crude oil's price action often moves in tandem with broader energy-sector sentiment, and geopolitical disruptions to major refining or export infrastructure tend to have an outsized short-term effect compared with typical supply-demand data releases.
The current refinery-strike headlines add a layer of uncertainty on top of the existing technical setup, which is part of why this channel test is drawing extra attention from traders tracking the US oil price today.
Expert Opinion
Market commentators tracking crude's reaction to the latest refinery strike note that supply-side shocks tied to major refining hubs typically produce sharp, short-term volatility even when the broader technical structure remains intact, making the current channel-support test more consequential than a routine pullback would normally be.
Disclaimer: This article is for informational purposes only and does not constitute financial advice. Commodity markets, including crude oil, are highly sensitive to geopolitical developments and can move sharply against any technical setup discussed here. There is a real possibility that WTI fails to reach any of the projected levels or moves in the opposite direction entirely. Readers should conduct their own research and consult a qualified financial advisor before making investment decisions.


















