Bundle Cat Price Prediction: Can BUN Hold Its Rally Into October 2026?


BUN jumped 42.7% in 24 hours, and the Bundle Cat price prediction debate got loud fast. An earlier BUN rally analysis tracked the start of that move.
And the chart already shows cooling.
Bundle Cat Price Prediction: Quick Snapshot
Data comes from CoinGecko market data at 07:06 UTC, September 29, 2026.
Metric | Snapshot |
Price / 24H | $0.09722 / +42.7% |
Market cap / volume | $20.124M / $4.735M |
Trend / RSI (1H) | Neutral short term / 56.80 |
Support | $0.09, $0.05662, $0.02763 |
Resistance | $0.11645, $0.1179, $0.12094 |
Next target | $0.15968 (needs $0.1179 break) |
Bull / Base / Bear | Above $0.1179 / $0.07 to $0.11 / Below $0.05662 |
Invalidation | Hourly trades below $0.05662 |
Why Is $BUN Moving So Sharply?
Recent Price and Volume Action
Breaking: $BUN surged 42.7% in 24 hours. Price ran from $0.05662 to $0.1179 on $4.735M volume. Fast.
Volume spiked on the breakout and pullback: interest, not direction. Related memecoin news updates add context.
BUN's Robinhood Chain and Mosh Structure
$BUN is the first token launched through Mosh on Robinhood Chain. Mosh uses bundled token launches and automated market-making agents, meaning bots that quote prices.
Basically, the launch model is part of the story. An official Bundle Cat post quoted news of a Mosh bundle funded within 5 minutes.
But a raise isn't a price floor.
BUN Technical Analysis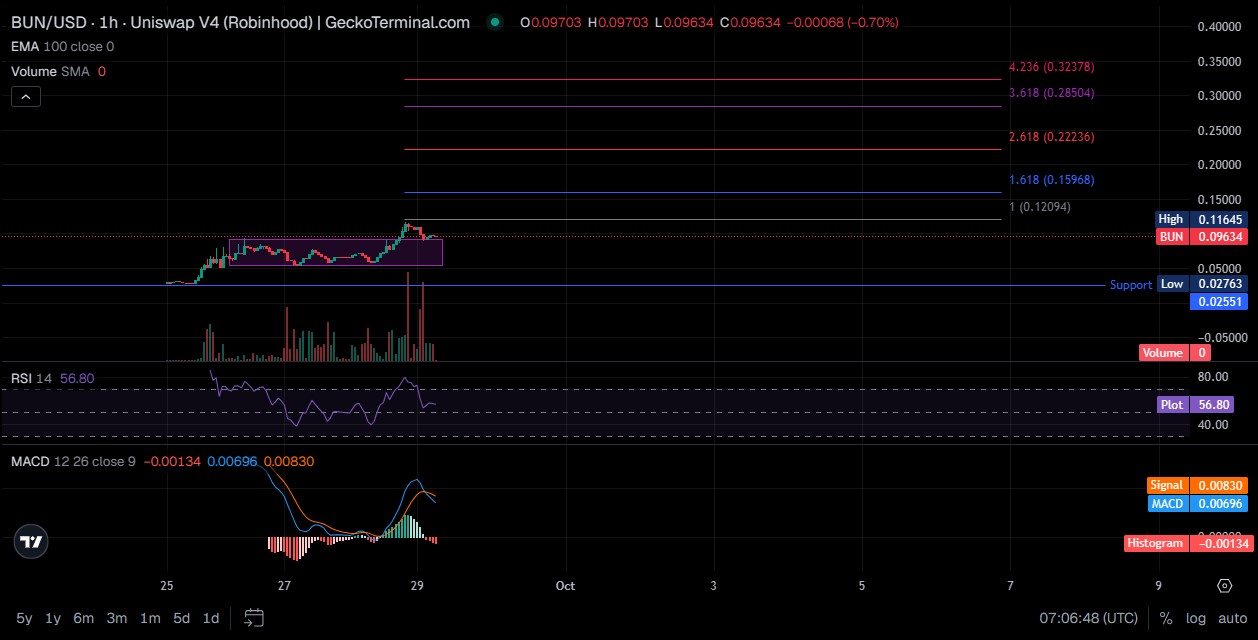
Trend Structure
This BUN technical analysis starts with the 1H chart: the price broke out, hit $0.11645, and slid to $0.09634 at 07:06 UTC. The GeckoTerminal BUN chart tracks the pool.
On the daily view, the 7D range of $0.02325 to $0.1179 shows a steep uptrend.
Steep runs rarely climb straight. But a pullback isn't a reversal.
RSI and Momentum
When we pulled up the RSI, the 1H reading sat at 56.80, down from near 80 at the peak.
Momentum seemed strong at first. Actually, scratch that: MACD, a trend-momentum tool, sits at 0.00696, under its signal line at 0.00830.
Support Levels
$BUN support levels start near $0.09, the old consolidation top. Holding it keeps buyers in control. A breakpoint is lower.
$0.05662 is the 24H low. Holding it keeps the range intact. Losing it exposes $0.02763, the chart's marked support.
Resistance Levels
The $BUN resistance levels cluster tightly, with two hurdles near $0.12.
$0.11645 is the swing high, where sellers stepped in.
$0.1179 is the all-time high. $0.12094 is the 1.0 Fibonacci level, a projection marker.
Can Bundle Cat Break Higher?
Bull Case
Resistance break plus volume targets $0.15968, the 1.618 Fibonacci extension. But $0.1179 must fall first.
A new listing would add liquidity, and exchange listing updates track those.
Base Case
Price ranges between $0.07 and $0.11, while $0.09 holds and momentum cools. Boring, yes. But boring follows spikes.
Bear Case
Support failure, fading volume, and weak bids point to a deeper retracement toward $0.05662.
Can buyers defend $0.09 with volume fading?
Invalidation Level
Hourly trades below $0.05662, the 24H low, invalidate the bullish setup.
Exactly.
Bundle Cat Price Prediction for October 2026
Scenario | Price Range | Conditions |
Bull | $0.12 to $0.16 | Breakout plus volume |
Base | $0.07 to $0.11 | Range holds |
Bear | $0.028 to $0.057 | Breakdown below $0.05662 |
These scenarios, based on 07:06 UTC data, aren't guarantees. The BUN price prediction for October 2026 favors the base case. Other crypto price predictions use similar tables.
BUN Price Prediction for 2027
Scenario | Price Range | Market Cap |
Base | $0.06 to $0.14 | $12.4M to $29.0M |
Bull | $0.22 to $0.32 | $45.5M to $66.2M |
Bear | $0.02 to $0.05 | $4.1M to $10.4M |
The BUN price prediction for 2027 assumes supply stays near 207M.
Base needs steady Mosh adoption. Bull needs lasting liquidity, maybe from crypto airdrops. Bear follows liquidity loss.
$BUN Tokenomics and Supply Structure
$BUN tokenomics start with a fixed supply: total and max supply both sit at 1B. BUN circulating supply is 207M, about 20.7%.
FDV, or fully diluted valuation, is $97.22M, about 4.8 times market cap. Turns out, supply context matters.
$BUN Liquidity and Holder Risks
Blockscout's token page lists 4,184 holders. The $BUN contract address is 0x07EBB29a38Fbcb41563817e5E19f2ceC619C90D2, Same-symbol tokens exist.
Here's the thing: a September 2, 2026 Unhosted snapshot reported 73.7% top-10 wallet concentration and $59,399 liquidity. Those figures aren't current.
Volume equals 23.5% of market cap. Pool depth data wasn't available.
What Could Drive $BUN Higher?
Positive Catalysts
Mosh adoption, new liquidity, rising trading activity, and buyer demand help. The coin events calendar tracks ecosystem news.
Negative Catalysts
Liquidity deterioration, concentrated selling, momentum reversal, and lost attention hurt. New launches, including memecoin presale listings, compete for attention.
BUN Price Prediction Risks
Extreme volatility, shallow liquidity, wallet concentration, young trading history, slippage (paying above quoted prices), copycats, and forecast error all apply.
Trader Takeaway
Watch resistance and volume for confirmation, support for downside risk, and liquidity for execution risk. Broader AI crypto news can shift attention fast.
Disclaimer
This content is for information only and isn't financial advice. Crypto assets carry high risk, and prices can fall to zero.



.webp)













