BUN Price Prediction: Can Bundle Cat Extend Its Rally?


Bundle Cat (BUN) traded at $0.06673, up 113% in 24 hours, per a snapshot taken at 05:30 UTC, September 26, 2026. The trend is bullish, with trades pressing resistance near $0.0788 while the $0.033 shelf holds as support.
The next seven days hinge on whether resistance breaks on real volume. Traders sizing up a fresh mover often start at a crypto price prediction hub. This BUN price prediction breaks down the data.
Bundle Cat Price Prediction: Quick Outlook
Here's the fast read before the deeper breakdown.
Metric | Reading |
Current Price | $0.06673 |
Trend | Bullish, cooling from overbought |
Next Target | $0.0985 |
Support | $0.033 |
Resistance | $0.0788 |
RSI | 70.86 |
Bull Case | Break above $0.0788 on volume |
Base Case | Range between $0.033 and $0.079 |
Bear Case | Loss of $0.033, retest near $0.02 |
BUN Price Today and Market Snapshot
Current Price and 24H Change
At 05:30 UTC, September 26, 2026, BUN traded at $0.06673, a 113% jump in a day. More moves like this land in meme coin news roundups.
Market Cap and Trading Volume
Market cap sits near $19.2 million against a fully diluted valuation (FDV) of $66.7 million, since FDV counts tokens not yet circulating. Volume hit $6.24 million.
Recent High and Low
The 24-hour range ran $0.02669 to $0.07888, also the all-time high. Trades sit about 14.7% below it, per Bundle Cat's CoinGecko.
Bundle Cat Technical Analysis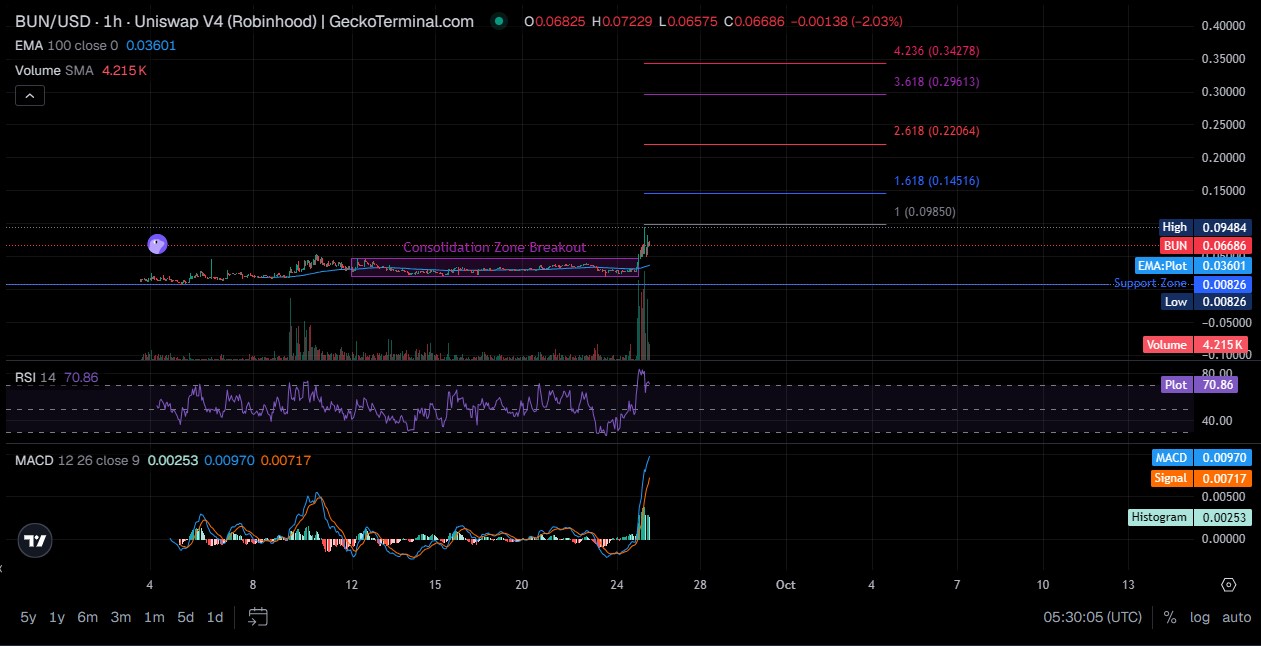
BUN Trend and Price Structure
The hourly chart shows a consolidation zone breaking open after weeks flat. Trades sit well above the 100-period EMA near $0.036, signaling momentum, not stability.
Support Levels
Support sits near $0.033; the shelf trades broke out from a deeper zone near $0.0083.
Resistance Levels
Immediate resistance sits near $0.0788. Fibonacci extensions above point toward $0.0985, then $0.145. Stretch targets, not forecasts.
RSI Analysis
RSI (Relative Strength Index), 14-period, reads 70.86. Overbought, not extreme. Momentum traders call it strength. Mean-reversion traders call it a warning.
MACD Analysis
MACD sits at 0.0097 against a signal of 0.00717, with a histogram positive at 0.00253. The crossover during the breakout backs the bullish read. But histograms this size flip fast.
Trading Volume Analysis
Volume spiked hard on the breakout candle, well above the average near 4,215. Turns out, follow-through candles held volume too, more telling than one spike. AI-linked mechanics here surface in AI-focused crypto reporting.
Bundle Cat 7-Day Price Prediction
Bullish Scenario
A close above $0.0788 on strong volume opens a path toward $0.0985. And with supportive sentiment, momentum could stretch toward $0.145.
Base Scenario
BUN chops between $0.033 and $0.079 for the week. This reads as the most defensible outcome, given how fast the token already ran.
Bearish Scenario
Losing $0.033 points back toward $0.027. A break there risks a retest closer to the all-time low of $0.008209.
Key Invalidation Level
Watch $0.033. Hold it; the structure stays intact. Lose it; the breakout thesis basically falls apart.
Bundle Cat Price Prediction for 2026
Bull Case
Continued Mosh and Robinhood Chain build-out, plus fresh venues on an upcoming listing events calendar, could push BUN toward mid-range extension levels.
Base Case
BUN holds part of its gains, trading in a wide range, with market cap settling between $19 million and its $66.7 million fully diluted figure.
Bear Case
A broader meme coin cooldown, or fading volume once hype cools, sends BUN back toward single-digit-cent territory, a scenario heavy whale concentration makes easy to trigger.
Bundle Cat Price Prediction 2027-2030
Year | Bear Case | Base Case | Bull Case | Main Driver |
2027 | $0.010 | $0.050 | $0.150 | Adoption and liquidity depth |
2028 | $0.008 | $0.080 | $0.250 | Ecosystem growth on Robinhood Chain |
2029 | $0.006 | $0.100 | $0.350 | Market cycle timing |
2030 | $0.005 | $0.120 | $0.450 | Long-term Mosh-linked demand |
These figures apply bear, base, and bull market-cap multiples to BUN's 288 million circulating supply. Read them as ranges, not fixed targets.
BUN vs. Other Robinhood Chain Tokens
Comparing BUN against unrelated meme coins misses the point. The more useful comparison sits within Robinhood Chain itself.
Metric | BUN | CASHCAT | PONS | SHROOM |
Category | Meme | Meme | Launchpad | Meme |
Approx. market cap | $19M | $165M | $420M | $26M |
Supply | 1B | 988M | 680M circulating | 1.4B |
Core narrative | Mosh, AI agents | Ecosystem, community | Launchpad, revenue | Ecosystem, liquidity |
These aren't ranked as better or worse. Supply structure, utility, and ecosystem role differ enough across all four that a direct "which one wins" comparison would be misleading.
What Could Drive Bundle Cat Higher?
Liquidity and Trading Activity
Pools tied to BUN sit across several Uniswap V4 pairs, trackable on BUN's live trading chart.
Mosh and Robinhood Chain Adoption
Bundle Cat is described as the first token launched via Mosh, a protocol pairing locked bundles with AI agents managing liquidity near other token launch listings.
Listings and Market Access
New pairings, like the recent Pons addition, expand where BUN can trade, tracked through an exchange listing tracker.
Broader Crypto Market Conditions
BUN doesn't trade in a vacuum. A risk-on market lifts small-cap tokens like this one. A risk-off shift does the opposite, fast.
Risks That Could Push BUN Lower
Low Trading History
BUN only started trading days ago. Predictions here lean on guesswork, not settled models.
Liquidity Risk
Liquidity across BUN's pools stays thin against its FDV, meaning bigger swings on smaller trades.
Volatility
A 113% daily move, followed by a pullback of over two points in the same session, tells its own story.
Supply and Valuation Risk
Only 288 million of the 1 billion total supply circulates today. Unlocks could pressure trades even with flat demand; see airdrop and supply tracking.
Breakdown Below Key Support
Break below $0.033 on volume, and the breakout structure fails, risking a slide back toward the pre-breakout range.
Bundle Cat Price Prediction: What Traders Should Watch
A handful of signals matter more than the rest right now.
Watch for a break above $0.0788, backed by volume, not a brief wick through it.
RSI cooling without price collapsing would be healthy. A MACD crossover that holds, not fades, matters too.
Whale wallets, concentrated per on-chain holder data, deserve close attention. How much of this rally is real demand?
Disclaimer
This article is for informational purposes only and does not constitute financial, investment, or trading advice. Cryptocurrency prices, including BUN, are highly volatile, and past performance offers no guarantee of future results. Independent research and professional consultation are recommended before making any investment decision.

















