Cardano Price Prediction: ADA Dominance Jumps 8%, Eyes $0.30 Next

Cardano is quietly doing something most traders have not noticed yet, and the chart is starting to hint at where this could be heading next.
Traders searching for a fresh Cardano price prediction are watching two things line up at once right now, and the setup on the hourly chart is not one you want to skip past.
This is a purely technical and data-based reading of the ADA chart and market metrics, with no personal position taken in Cardano.
Cardano Price Today: Live Data
Cardano is trading at $0.2598, up 3.67% in the past 24 hours, according to CoinGlass. The ADA market cap stands at $9.51B with open interest of $617.53M.
Futures volume over 24 hours reached $1.00B, while spot volume came in at $222.81M.
Circulating supply is 36.76B ADA against a total supply of 44.99B and a max supply capped at 45.00B, keeping ADA price prediction discussions anchored to a fully transparent supply schedule.
Source: CoinGlass, September 23, 2026.
Cardano News Today
Dominance data is where the real Cardano news today is hiding. 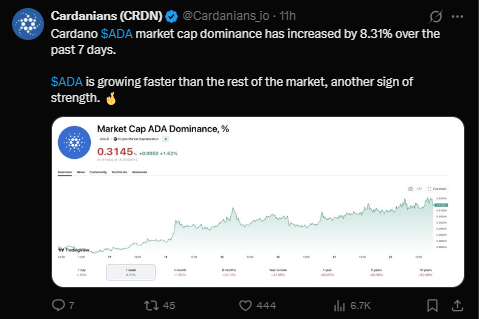
A post from Cardanians on X flagged that ADA market cap dominance has climbed 8.31%. over the past seven days, currently sitting near 0.3145% of the total crypto market cap and up 1.61% on the day.
The framing here matters for anyone doing Cardano trend analysis: ADA is not just moving with the market; it is gaining share of it, which technicians often read as an early sign of accumulation ahead of larger moves.
Source: Cardanians (@Cardanians_io) on X, September 23, 2026.
Quick Take
CMP: $0.2587 (1h chart, Binance ADA/USDT perpetual)
Trigger level: close above $0.2884 targets $0.3134
Failure level: close below $0.2408 exposes $0.2183
Data timestamp: September 23, 2026
Risk note: levels are based on hourly closes; intraday wicks through either zone do not confirm a break
Cardano Price Prediction Technical Analysis
The hourly chart tells a fairly clean story. ADA spent the prior sessions climbing along an ascending trendline, and the price has now pushed through that structure with a move up to the 0.2587 to 0.2600 zone. 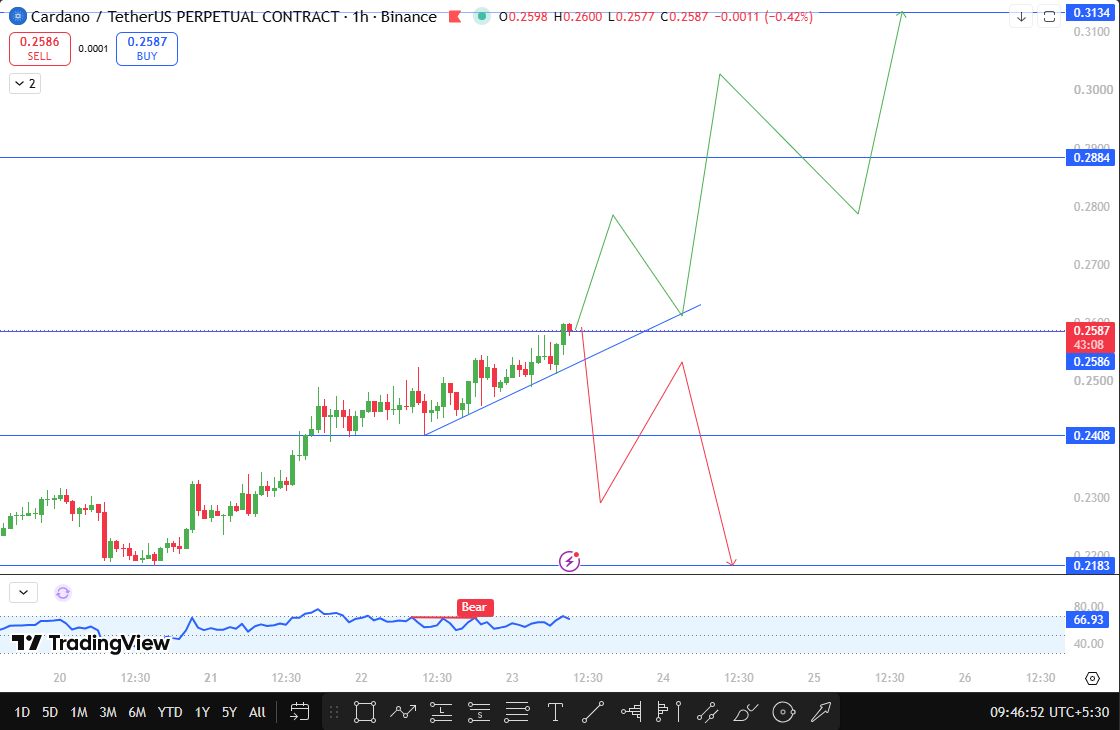
The breakout came after several candles compressed right against the trendline, which is usually the kind of coiling that precedes a directional push rather than a fake-out.
What stands out is how this technical picture lines up with the dominance data from Cardanians.
When a coin is breaking structure on its own chart while also pulling market cap share away from the rest of the field, that combination tends to draw more attention from momentum traders, and it can accelerate a move once a key level gives way.
The RSI-style bear label seen on the chart around the mid-20s to 23 date range suggests momentum cooled briefly before this latest push, which fits a healthy retest pattern rather than an exhausted trend. Source: TradingView, September 23, 2026.
Cardano Support and Resistance Levels
Level Type | Price | % Distance from CMP |
Resistance 2 | $0.3134 | +21.1% |
Resistance 1 | $0.2884 | +11.5% |
Current Price | $0.2587 | - |
Support 1 | $0.2408 | -6.9% |
Support 2 | $0.2183 | -15.6% |
Bull Base Bear Cardano Price Outlook
In the bullish case, ADA holds above the reclaimed trendline and grinds toward 0.2884.
A clean close above that level would put 0.3134 on the table fairly quickly, especially if the dominance trend keeps building the way Cardanians described it this week.
The base case has ADA chopping between 0.2408 and 0.2884 for a stretch, working off the recent gains before committing to a direction, which is a pretty normal pause after this kind of run.
The bearish case only opens up if buyers lose the 0.2408 shelf, and if that gives way, there is not much standing in the way of a slide back toward 0.2183, since that zone is the next real demand area on the chart.
Risks To This Cardano Price Prediction
Momentum can fade quickly on lower timeframe charts like the hourly, so a breakout above 0.2884 needs follow-through volume to be trusted.
Broader crypto market sentiment, particularly Bitcoin dominance swings, can override coin-specific setups.
Liquidation cascades on either side of 0.2408 or 0.2884 could cause sharp wicks that do not reflect the actual close.
Glossary
Dominance: The percentage of total crypto market capitalization held by a single coin.
Ascending Trendline: A rising support line connecting a series of higher lows.
Open Interest: The total value of outstanding derivative contracts not yet settled.
Disclaimer
This article is for informational purposes only and does not constitute financial advice. Cryptocurrency markets are highly volatile. Always do your own research before making investment decisions.
















