Cardano Price Prediction: ADA Enters AI Payments, Eyes $0.30 Next

Cardano price prediction chatter just picked up a fresh spark, and the timing is hard to ignore.
A new headline is pulling AI-driven payments into the $ADA conversation, while the chart is quietly setting up a moment traders have been waiting for.
Two stories are now landing on the same day. Here is how they fit together.
Editorial note: our desk holds no personal position in ADA. This is purely a chart and data read.
Cardano Price Today: Live ADA Price and Market Data
Cardano is changing hands at 0.2505, down 0.36% on the day. Market cap sits at 9.10B, while open interest stands at 583.76M.
Futures volume over 24 hours reached 599.93M against spot volume of 104.07M, so derivatives traders are doing most of the talking.
Circulating supply is 36.77B ADA out of a 44.99B total and a 45.00B maximum.
For a similar trendline setup on another large cap, see our Chainlink price prediction analysis.
Source: CoinGlass, Sep 28, 2026
Cardano News Today: ADA Enters the AI Payment Stack
An X post from Giannis Andreou (@gandreou007) says Cardano has been added to an official X402 toolkit. 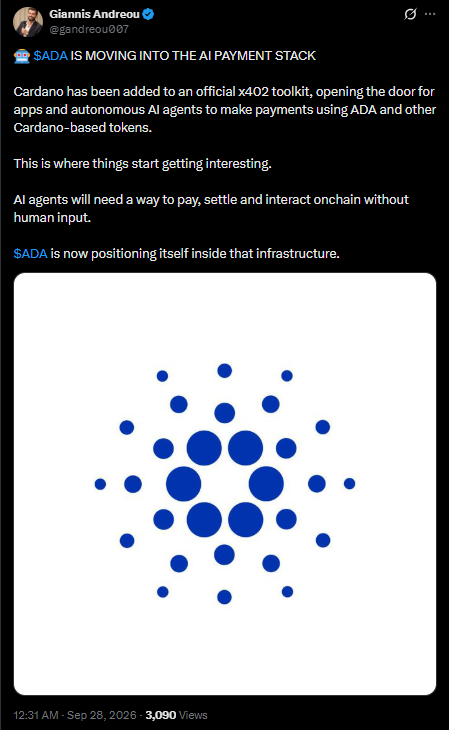
In plain terms, apps and autonomous AI agents can now make payments using ADA and other Cardano-based tokens.
His argument is that AI agents will need a way to pay, settle, and interact on-chain without human input, and ADA is now positioning itself inside that infrastructure.
It is a social media claim, so treat it as narrative fuel rather than confirmed adoption. Readers tracking this theme can also browse our best AI crypto tokens list.
Source: X post by @gandreou007, Sep 28, 2026, 12:31 AM
Quick Take
CMP: 0.2503 (1-hour chart, Binance)
Bullish trigger: 1-hour close above 0.2587
Failure level: 1-hour close below 0.2328
Data timestamp: Sep 28, 2026, 09:54 UTC+5:30
Risk note: a retest can hold or break, so wait for the close.
Cardano Price Prediction 2026 Technical Analysis
ADA has spent the last 10 days building a staircase. From the 0.2183 zone, the chart shows a clean ascending trendline that has been respected several times, and the second retest is now unfolding right at 0.2503. 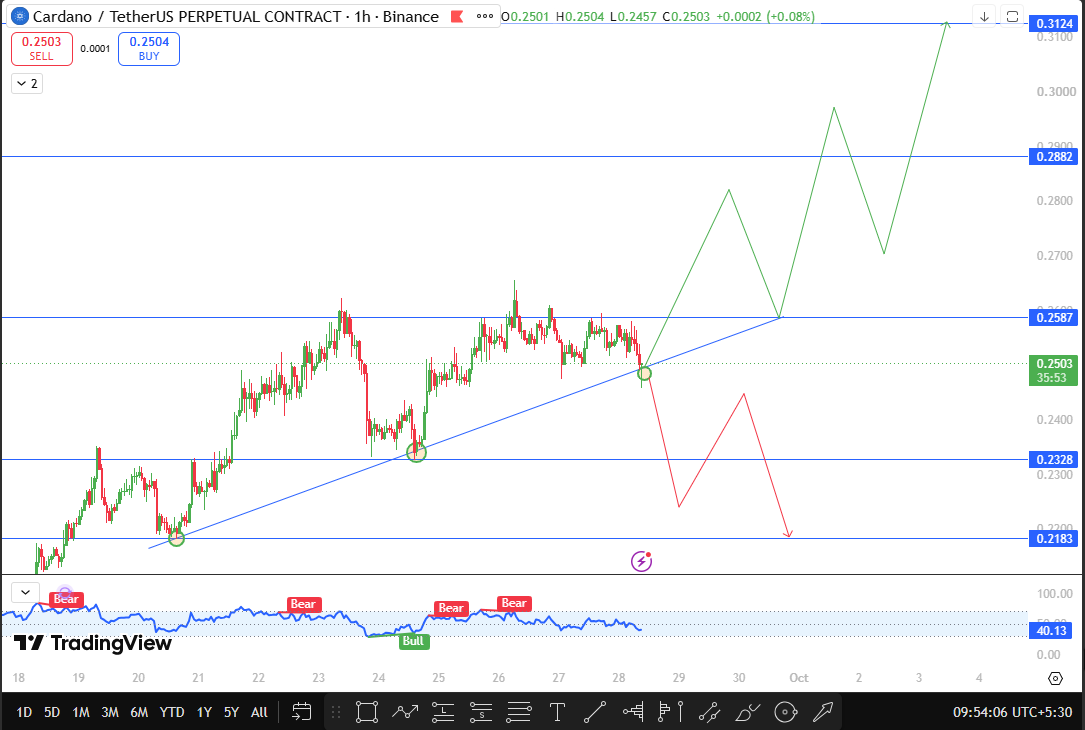
The first serious test of that line, around the 24th, produced a sharp bounce that carried the price just above 0.2600 before momentum faded.
Since then $ADA has drifted sideways under the 0.2587 ceiling, and the latest candle has dipped back onto the line.
That matters for any ADA technical analysis because a second retest is where a trendline earns its reputation. If it holds, buyers are still defending higher lows.
If it fails, the same line can flip into overhead pressure. The oscillator on the chart reads 40.13, below its midline after a run of bearish labels, which suggests short-term momentum has cooled rather than collapsed. Cooling into support is healthy. Cooling through support is not.
The bullish path needs a 1-hour close above 0.2587.
That level capped the recent advances, so a clean close above it would turn resistance into support and open the road to 0.2882, with 0.3124 as the extended target marked on the chart.
The bearish path needs a 1-hour close below 0.2328, which would sit well beneath the trendline and confirm a breakdown. The next ADA support level would then be 0.2183.
Between 0.2328 and 0.2587, expect noise, fakeouts, and liquidity hunts. Patience beats prediction in that zone.
Source: TradingView, ADA/USDT perpetual, 1H, Binance, Sep 28, 2026, 09:54 UTC+5:30
Cardano Support and Resistance Levels
Level | Type | Distance from CMP (0.2503) |
0.3124 | Extended resistance | +24.81% |
0.2882 | Next resistance | +15.14% |
0.2587 | Breakout trigger | +3.36% |
0.2328 | Breakdown trigger | -6.99% |
0.2183 | Next support | -12.78% |
Bull, Base, and Bear Scenarios for ADA
Bull case. $ADA defends the trendline, pushes back into the range, and closes above 0.2587 on the 1-hour chart.
That would be the first real sign that the AI payment story is drawing buyers. Price could then work toward 0.2882 in stages, with pullbacks along the way, and 0.3124 becomes the stretch target if strength holds.
Traders comparing majors can check our Bitcoin price outlook this week for broader market context.
Base case. ADA keeps bouncing between the trendline and 0.2587 for a while. Volume stays thin, the oscillator hovers in the low 40s, and neither side commits. This is the most likely near-term outcome given how tightly price has been squeezed.
Bear case. The trendline gives way, and a 1-hour candle closes below 0.2328. Sellers then get a clear target at 0.2183, and any bounce on the way down would likely stall near the broken line. A move like that would erase most of the recent gains from the ascending structure.
Risks to Watch
Derivatives dominate ADA trading, with futures volume at nearly six times spot, so sudden liquidation moves can distort a clean setup. The x402 headline comes from a single social post, and headline-driven rallies fade quickly without follow-through.
A 1-hour chart also reacts fast, so false breaks are common. Broader crypto sentiment, including moves in Hyperliquid price forecast updates and other majors, can override any single-coin pattern.
Cardano 2030 Price Outlook
Autonomous agents settling payments on-chain could give ADA a use case far bigger than today's 0.25 price suggests.
With 36.77B of a 45.00B cap already in circulation, supply growth is limited, so demand from machine-driven settlement carries the weight. Our 2030 estimate for ADA is 1.10.
Glossary
Retest: price returning to a broken or respected level to test whether it holds.
Trendline: a line joining higher lows that marks rising support.
x402: a payment standard that lets apps and AI agents pay onchain.
Disclaimer
This article is for educational and informational purposes only and is not financial advice. Crypto assets are highly volatile. Do your own research before making any trading decision.

















