Dogecoin Price Prediction: Can DOGE Hit a New High As ETF Inflow Surge


Spot Dogecoin ETFs just had their best week ever, yet DOGE fell almost 3% today.
This Dogecoin Price Prediction looks at whether the dip is a pause before the next jump, with $0.091962 the level to hold.
Dogecoin News: Spot DOGE ETFs Have Their Best Week Ever
A social media post said spot Dogecoin ETF products took in $2.89M this week, the most they have ever absorbed in a single week.
The post said only one week in January 2026 came close, with $2.59M in net inflows. An ETF (exchange-traded fund) lets people buy exposure to a coin through a regular stock account.
CoinGabbar could not independently verify these numbers, as no fund data was linked in the post.
DOGE Price Today: Technical Analysis
The chart shows a pattern that has repeated three times since August. Price jumps sharply, then drifts down inside a descending channel. Twice already, DOGE broke out of that channel and jumped again.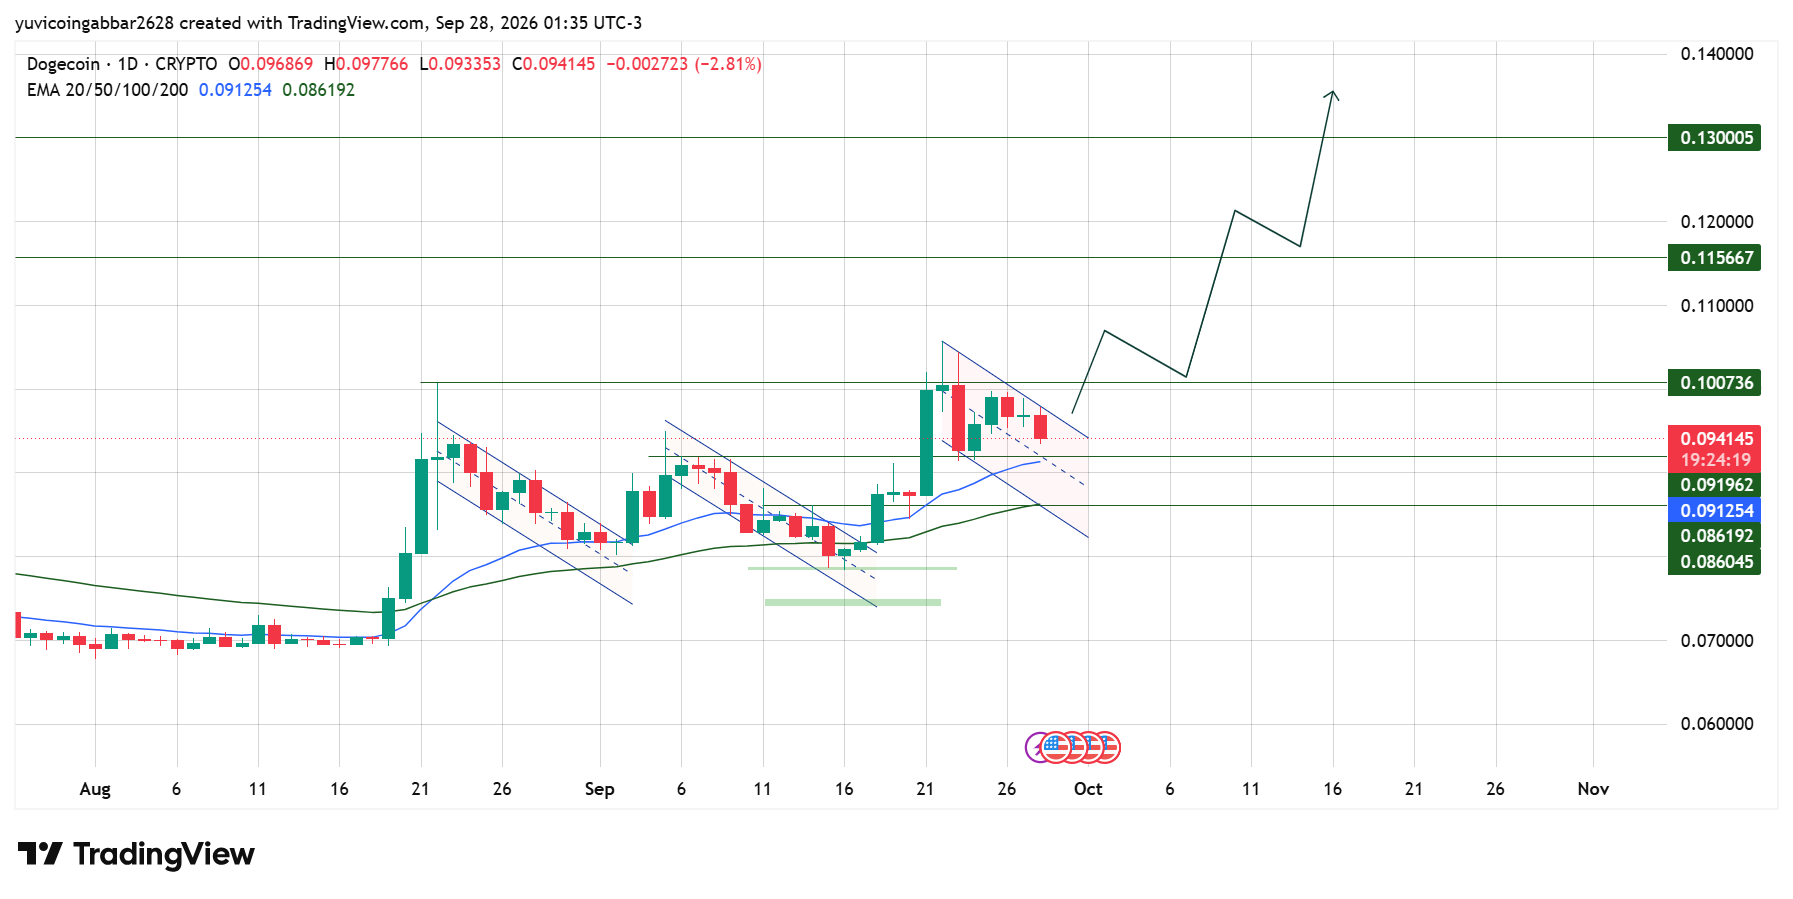
Right now $DOGE is inside the third channel. After the September jump toward $0.105, the Dogecoin price today has slid back to $0.094145, down 3% today. The channel is still sloping gently down, and the price has not yet broken out.
Two EMAs sit below price. The 20 EMA is at $0.091254, and the 50 EMA is at $0.086192.
Price is above both, which means the bigger trend is still up.
The $0.091962 level sits right next to the 20 EMA, so this area is the first place buyers are likely to step in.
Dogecoin Outlook Key Levels
Level Type | Price |
Resistance 3 | $0.130005 |
Resistance 2 | $0.115667 |
Resistance 1 (nearest) | $0.100736 |
Immediate Price Reference | $0.094145 |
First Confirmed Support | $0.091962 |
EMA Support Zone | $0.091254 to $0.086192 |
Deeper Support | $0.086045 |
Dogecoin Price Forecast
Bull case: If the price holds above $0.091962 and breaks out of the channel, $DOGE would repeat the pattern of the last two breakouts.
The first target would be $0.100736, then $0.115667. The record ETF inflows add a reason for buyers to stay interested.
Bear case: A close below $0.091962 would break the pattern. Losing the EMA zone down to $0.086192 would suggest the third flag has failed, and $0.086045 would be the next support.
Dogecoin Price Prediction: Can Dogecoin Reach $0.130005?
$0.130005 is the highest level marked on the chart. To reach it, DOGE must first clear $0.100736, then $0.115667. That is a move in steps, and it would need the breakout to hold each time.
Dogecoin Price Prediction 2026: Expert View
According to CoinGabbar analysts, the same setup has now shown up three times in about five weeks, and the first two ended with a breakout.
That gives the current dip a fair chance of doing the same. Still, patterns do not always repeat, so a close above the channel is what would confirm it.
Disclaimer
This piece is for informational purposes only and isn't financial advice. The levels and scenarios above are based on technical chart analysis and publicly available data at the time of writing. Crypto markets can move sharply within hours, so past patterns don't guarantee future outcomes. Do your own research and consider your risk tolerance before acting on any level discussed here.

















