Chainlink Price Prediction: Can 16 Integration Push LINK Toward $80


Chainlink price prediction is getting interesting again, and LINK may have just reached a moment that traders have been waiting for.
Something on the chart is starting to shift, while fresh ecosystem activity adds another layer to the story.
But is this just another short-term bounce, or could it be the beginning of a much bigger move? The next reaction could reveal whether LINK is ready to surprise the market.
Keep reading, because what happens next could completely change the LINK outlook.
Chainlink Price Today: Live Data and Market Snapshot
LINK is priced at $12.568, up 4.7% on the day. Futures volume over 24 hours stands at $566.84M against spot volume of $104.41M, showing derivatives desks are more active than spot buyers right now. Market cap sits at $9.43B with open interest at $682.79M.
Circulating supply is 748.09M LINK out of a 1.00B total and max supply, meaning nearly three-quarters of all LINK that will ever exist is already in circulation. (Source: CoinGlass, Sep 21, 2026)
Chainlink News Today: Adoption Keeps Stacking Up
The Chainlink news today's angle is adoption breadth rather than a single headline. 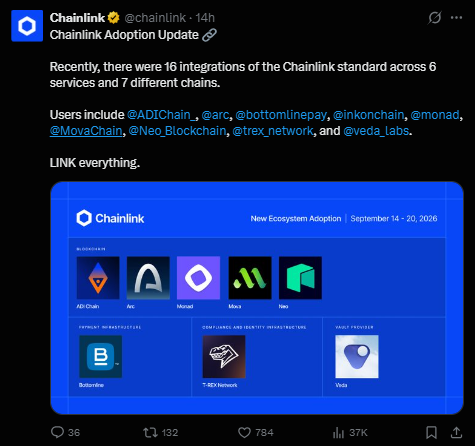
Chainlink's own account posted an ecosystem update covering September 14 to 20, showing 16 integrations of the Chainlink standard spread across 6 services and 7 different chains in a single week.
Names pulled into that update include ADI Chain, Arc, Bottomline, Ink, Monad, Mova Chain, Neo, T-REX Network, and Veda, spanning blockchains, payments infrastructure, compliance tooling, and vault providers.
That kind of spread across categories is usually a stronger signal for long-term Chainlink trend analysis than any single partnership, since it shows the standard getting embedded rather than just announced once.
(Source: X post by Chainlink, Sep 2026)
Quick Take
CMP: 12.575 (4h chart)
Trigger level: close above 13.686 confirms bullish continuation
Failure level: close below 11.955 confirms bearish breakdown
Data timestamp: Sep 21, 2026, 4h Binance perpetual chart
Risk note: levels are close-based, not wick-based; a wick through a line without a close does not confirm the move
Chainlink Price Prediction 2026 Technical Analysis
On the 4h Binance perpetual chart, LINK has been riding an ascending trendline since its September low, and price has just pulled back into that line for its first genuine retest.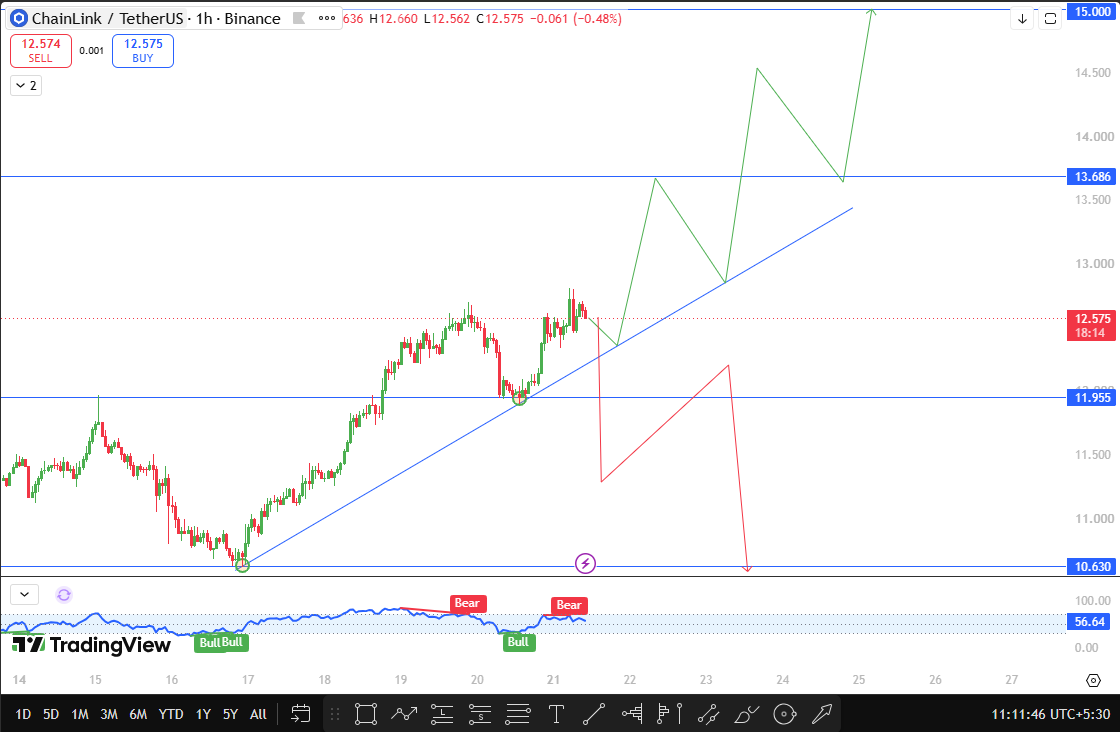
So far the reaction has been a bounce rather than a break, with LINK turning higher off the trendline and back toward 12.575.
This kind of first retest is often where a Chainlink technical analysis view gets its clearest signal.
If the trendline keeps holding and buyers push LINK through 13.686 with a confirmed 4h close, that level flips from resistance into support and clears the runway toward 15.000, a level that also lines up as a clean psychological round number.
On the downside, the trendline itself is the level to watch first. Losing it without a bounce would be an early warning sign, and a confirmed close below 11.955 would mark a real structure break rather than a routine dip, pointing next toward 10.630 as the level buyers would likely step back in.
The RSI on this chart has been marked with alternating Bull and Bear tags through recent swings, currently sitting in the mid-50s zone, which is neither stretched nor exhausted. That leaves room for LINK to run either way once one of these two key closes actually happens.
Chainlink Support and Resistance Levels to Watch
Level | Price | Distance From CMP |
Resistance 2 | 15.000 | 19.28% above |
Resistance 1 | 13.686 | 8.83% above |
CMP | 12.575 | — |
Support 1 | 11.955 | 4.93% below |
Support 2 | 10.630 | 15.47% below |
Bull Case, Base Case, And Bear Case For LINK
In the bull case, the trendline retest holds, LINK closes above 13.686, and the steady drip of ecosystem integrations keeps the Chainlink price prediction narrative supported into a run at 15.000. This scenario fits best with what the chart is showing right now.
In the base case, $LINK spends more time chopping between the trendline and 13.686, unable to commit fully either way. A LINK price forecast built around this range would want a decisive close outside it before treating either target as active.
In the bear case, the trendline gives out on a closing basis, LINK slips below 11.955, and sellers take the move down toward 10.630. Given how much of the current volume is futures-driven, a break like that could move quickly once leveraged longs start unwinding.
Chainlink Price Prediction 2030: A Quick Long-Term Look
By 2030, Chainlink's expanding role as the connective layer across chains, payments, and compliance infrastructure supports a meaningfully higher long-term valuation than today.
With adoption spreading across dozens of new integrations every few months, a reasonable long-range estimate places LINK somewhere between $40 and $80 by 2030, assuming this integration pace continues and Chainlink keeps its position as the default oracle and interoperability standard.
Risks To Watch
A leverage-heavy market like this one can reverse fast if funding flips or a cluster of longs gets liquidated at once.
Adoption headlines can also lose their punch quickly if new integrations do not translate into visible on-chain usage.
Every level in this Chainlink price forecast should be treated as conditional on a real close, not a brief touch.
Glossary
Trendline: A line connecting a series of highs or lows used to gauge trend direction.
Retest: When the price returns to a broken or held level, confirm it before continuing.
Break And Close: A price move that closes beyond a level on the relevant timeframe, rather than just wicking through it.
Open Interest: The total value of outstanding derivative contracts still open on an asset.
CMP: Current market price, taken directly from the live chart.
Disclaimer
This article is for informational purposes only and does not constitute financial advice. Cryptocurrency markets are volatile, and readers should do their own research before making any investment decisions.


















