Chainlink Price Prediction: Why Did LINK Hit A 2026 High Then Fade?


One of this week's busiest charts has landed somewhere worth watching. This Chainlink price prediction covers where LINK trades right now, which levels carry the weight, and how the recent CCIP 2.0 rally fits in.
It is a chart and data read from the editorial desk, not a personal position and not advice.
Chainlink Price Today: Price Data, Market Cap, and Open Interest
LINK trades at $14.245 on the 4-hour Binance LINKUSDT perpetual chart. A perpetual is a futures contract with no expiry date, and we treat this print as the CMP, or current market price. The latest candle is down 0.41%.
CoinGlass lists Chainlink at $14.229, down 6.05% over the past day. Market cap is $10.65B. Open interest, the total value of futures positions still open, is $768.81M.
Futures volume is $896.24M against $147.64M in spot, so derivatives trading runs about six times the spot activity. Circulating supply is 748.09M, and both total and max supply sit at 1.00B.
Source: CoinGlass and TradingView, Sep 30, 2026, 2:09 PM IST.
Chainlink News Today: CCIP 2.0 Rally and Its Price Impact Explained
crypto.news (@cryptodotnews) posted on X a day ago that LINK hit its highest price of 2026 at $15.75. 
At that point the token was around $15.29, up 11.81% on the day, while daily trading volume jumped 216% past $1.41 billion after the rollout of CCIP 2.0. CCIP is the Cross-Chain Interoperability Protocol, the layer that lets apps send messages and tokens between blockchains.
That burst has cooled. Price now sits about 9.6% below the $15.75 high, which suggests early buyers took profits fast.
The volume surge shows real interest in the upgrade, but one strong day is not a trend, so treat this as a sentiment driver to respect, not a signal to chase.
Source: crypto.news on X, Sep 30, 2026.
LINK Price Forecast Quick Take: Key Price Target and Trigger Levels
Chainlink is at $14.245 and leaning on its ascending trendline for a second retest.
A 4-hour close above $15.777 opens the path to $21.500.
A close below $13.340 points to $11.896 as the next support.
The RSI, a momentum oscillator, reads 48.79, close to neutral, after two bearish divergence flags near the recent peaks.
Data is timestamped Sep 30, 2026, 2:09 PM IST, and the trendline hold is not confirmed yet.
Chainlink Technical Analysis: Ascending Trendline Retest Setup
Methodology: 4-hour timeframe, Binance perpetual, RSI oscillator, invalidation on a 4-hour close below $13.340.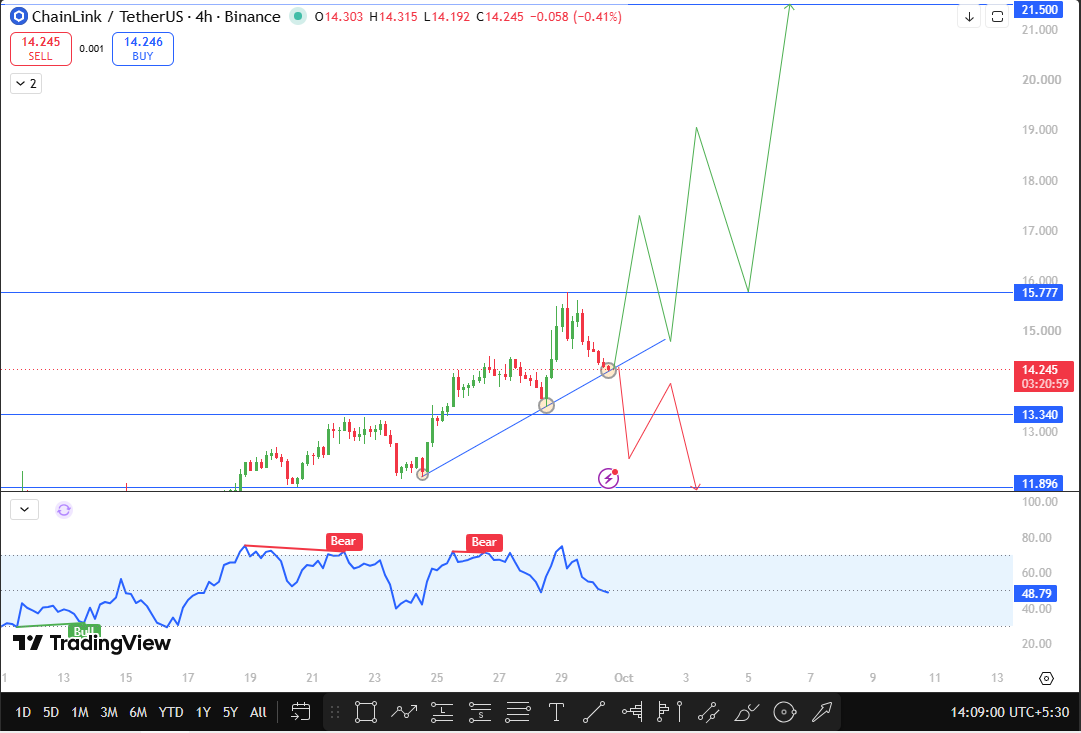
This Chainlink technical analysis starts with the trendline. Price climbed along an ascending line from the Sep 24 low, pushed to $15.777 earlier this week, and has now slid back to the line for its second retest. Retests are where a trend either proves itself or cracks.
The RSI reading of 48.79 sits right near the midpoint, and it printed bearish divergence twice near recent highs, meaning price reached new peaks while momentum failed to match.
That is a caution flag, not a verdict. If the line holds and a 4-hour close lands above $15.777, the LINK price target zone opens toward $21.500.
If buyers fail, a 4-hour close below $13.340 would break the structure and put $11.896 in play. A wick through either level alone proves little. Our Chainlink trend analysis stays constructive only while price respects the line.
Source: TradingView, Sep 30, 2026, 2:09 PM IST.
LINK Support and Resistance Levels: Breakout and Breakdown Zones
Level | Type | Price | Distance from CMP |
Major resistance | Resistance | $21.500 | +50.93% |
Breakout trigger | Resistance | $15.777 | +10.75% |
CMP | Current price | $14.245 | 0.00% |
Breakdown trigger | Support | $13.340 | -6.35% |
Major support | Support | $11.896 | -16.49% |
Chainlink Price Forecast: Bull, Base, and Bear Price Scenarios
Bull case. The trendline holds, and a 4-hour close lands above $15.777 (+10.75%). That would clear this week's high and open $21.500 (+50.93%), a long gap with no chart level in between, so a move on this path needs patience and a firm stop.
Base case. Price works sideways along the line, stuck between $13.340 and $15.777. Small candles and failed pushes are normal here. Traders waiting for confirmation simply stay flat.
Bear case. A 4-hour close below $13.340 (-6.35%) breaks the trendline and the run of higher lows with it. Next support is $11.896 (-16.49%). The 6.05% drop over the past day and an RSI just under 50 show sellers have held the recent edge.
LINK Price Risks: What Could Break This Price Forecast Setup
Leverage is the big one. Futures volume runs about six times spot, and open interest is $768.81M, so a move can overshoot a level before it settles.
Trendlines also get wicked through, which is why this read leans on 4-hour closes. The CCIP 2.0 burst was a one-day event and has already faded. And wider crypto swings can override any single chart.
Disclaimer
This article is for information only and is not financial advice. Crypto assets are volatile, and you can lose your entire investment. Always do your own research and consult a licensed advisor before trading.










.webp)











