Chainlink Price Prediction: Why Is LINK Up 8% Today After ETF News?


Chainlink price prediction discussions are heating up again, and this time institutional money seems to be doing a lot of the talking.
LINK has spent the past week climbing steadily inside a well-defined channel, and fresh ETF inflow data suggests the buying pressure isn't just retail-driven.
Anyone watching the LINK price prediction conversation right now is looking at a chart that's giving fairly clean signals on both sides.
This piece is built off chart structure and flow data, not a personal trade or holding.
Chainlink Price Today Live Data
LINK is changing hands at $13.38 right now, up a healthy 8.07% on the day according to CoinGlass.
The token's market cap has climbed to $10.04B, and trading activity backs that up; futures volume sits at $858.35M against $171.25M in spot volume over the last 24 hours.
Open interest is running at $750.34M, and out of a fixed 1.00B total supply, 748.09M LINK tokens are already circulating.
That leaves a fairly limited new supply left to enter the market going forward, which is worth keeping in mind for anyone tracking Chainlink price forecast scenarios longer term.
Source: CoinGlass, September 25, 2026
Chainlink News Today Spot ETF Flows
The biggest Chainlink news today comes straight from the ETF side of the market. BSCN (@BSCNews) posted on X that spot ETFs now hold roughly 1 in every 45 LINK tokens in existence. 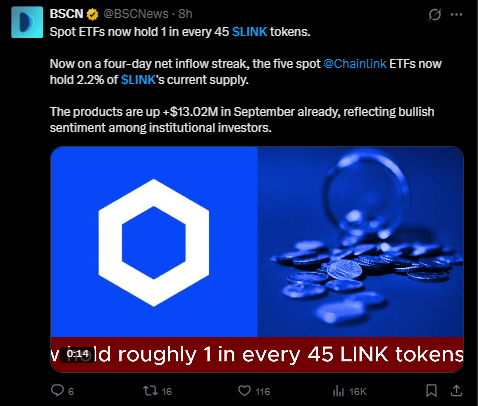
Dig a little deeper and the number gets more striking; the five-spot Chainlink ETFs currently tracked have hit a four-day streak of net inflows and together control 2.2% of LINK's entire circulating supply.
Just in September alone, these products have pulled in over $13.02M, which BSCN framed as a clear sign of growing institutional confidence in the token.
When funds start quietly stacking a meaningful slice of total supply like this, it tends to show up in price action sooner or later, and the chart below suggests it already might be.
Source: BSCN (@BSCNews) on X, September 25, 2026
Quick Take on LINK Setup
Current Market Price: 13.387 (4h Binance LINK chart)
Upside Trigger: Close above 13.672, roughly 2.13% above CMP
Downside Trigger: Close below 11.912, roughly 11.02% below CMP
Data Timestamp: September 25, 2026, 11:48 IST
Risk Note: Channel trades can whipsaw hard near the boundary lines, so wait for the candle to actually close before acting on either side.
Chainlink Price Prediction 2026 Technical Analysis
Pull up the 4h LINK chart, and the story is pretty easy to read. Price has been grinding higher inside an ascending channel since around mid-September, bouncing off the lower boundary line more than once and using it as a springboard each time. 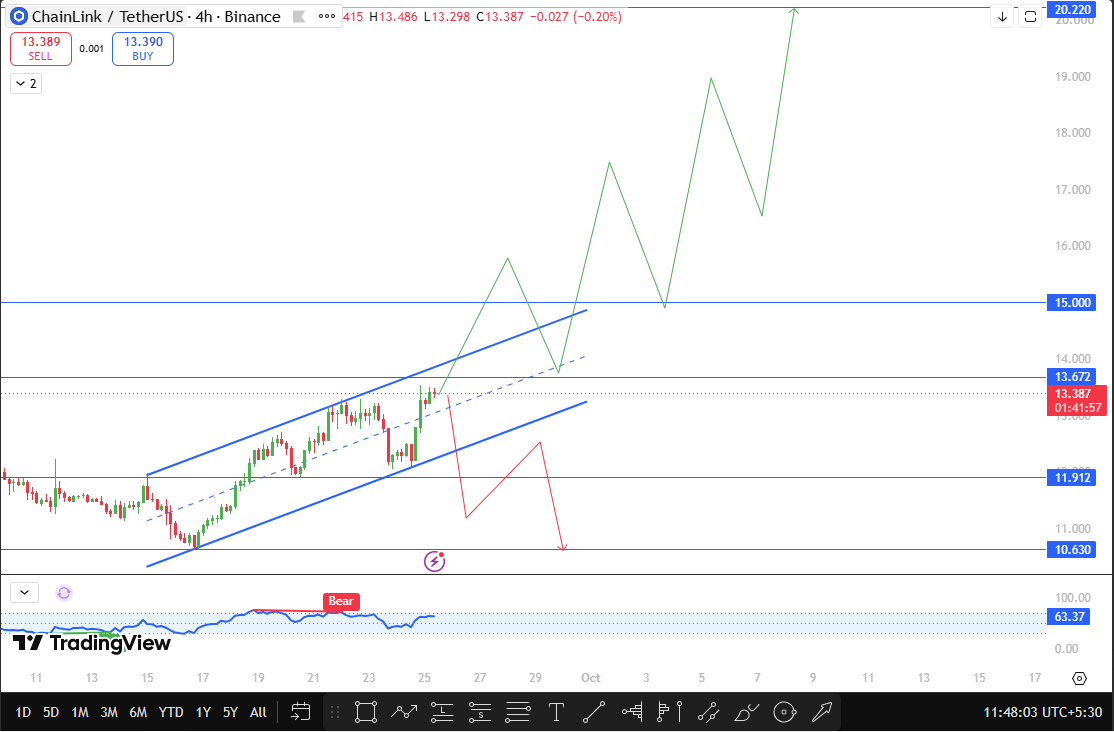
That kind of repeated respect for a trendline usually tells you buyers are stepping in with intent rather than by accident.
Momentum backs this up too. The RSI is reading 63.37 right now, comfortably in bullish territory without being stretched into the overbought danger zone yet.
Earlier in the move there was a brief bearish flag on the indicator, but that faded fast as price kept grinding upward, which is often how a healthy uptrend behaves rather than a warning sign.
Zoom out and the projection gets interesting. If LINK manages a 4-hour close above 13.672, the path opens toward the psychological 15.000 mark first.
Clear that with conviction and the chart pointing at a much bigger number further out, the 20.220 zone would mark a serious extension from where price sits today.
On the flip side, if the channel gives way and LINK closes below 11.912, the setup flips and 10.630 becomes the level to watch as the next real floor.
Chart source: TradingView, Binance LINK spot, 4h timeframe, September 25, 2026, 11:48 IST
LINK Support and Resistance Levels Explained
Level | Type | Distance from CMP |
10.630 | Major Support | 20.59% below |
11.912 | Channel Support | 11.02% below |
13.672 | Channel Resistance | 2.13% above |
15.000 | Psychological Resistance | 12.05% above |
20.220 | Major Resistance | 51.04% above |
Bull Base and Bear Scenarios for LINK
If you're leaning bullish on this one, a 4h close above 13.672 is what you want to see first. That's the trigger that would confirm the channel is still intact and buyers are firmly in charge, with 15.000 sitting right there as the first obvious magnet for price.
Get past that cleanly, and there's a real argument for LINK stretching all the way toward 20.220 over time, especially with ETFs quietly soaking up supply in the background.
The more boring but honestly more likely outcome in the short run is that LINK just keeps riding the channel, bouncing between the two trendlines without doing anything dramatic.
Given how orderly this move has looked so far, a bit of consolidation inside the channel wouldn't be surprising before the next real push.
Now for the less exciting scenario. A 4h close below 11.912 would break the channel structure, and that's the kind of move that tends to invite more selling rather than less.
In that case, 10.630 becomes the level buyers would need to defend to keep the broader uptrend story alive. A quick failed bounce back under 13.672 after any brief recovery would be an early tell that the bears are still in the driver's seat.
Risks to Watch Before Trading LINK
ETF inflows are a genuinely bullish signal, but they can reverse just as fast if broader crypto sentiment sours, so treating them as a one-way guarantee would be a mistake.
Bitcoin's own price action still tends to drag altcoins like LINK around regardless of how clean an individual chart looks.
There's also the simple reality that a 51% move to 20.220 is a big ask in a short window, so getting greedy on target expectations without respecting intermediate resistance at 15.000 could leave a trade exposed longer than planned.
Chainlink Long-Term Outlook 2030
By 2030, I'd put LINK somewhere in the $35 to $55 range, and the ETF trend is a big part of why.
Once regulated products start locking away meaningful chunks of supply the way these five funds already have, it tends to change the entire supply and demand math for a token over a multi-year stretch.
Add in Chainlink's continued role connecting real-world data to blockchain networks, and the long-term case looks less speculative than it might have a couple of years back.
Glossary of Key Terms
Ascending Channel: A price structure formed by two parallel upward-sloping trendlines marking support and resistance.
Support: A price zone where buying pressure has historically stepped in.
Resistance: A price zone where selling pressure has historically capped upside.
RSI: Relative Strength Index, a momentum gauge running from 0 to 100.
Open Interest: The total value of outstanding futures contracts yet to be settled.
Disclaimer
This article is for informational purposes only and does not constitute financial advice. Cryptocurrency markets are volatile, and you should do your own research before making any trading or investment decision.

















