Why China Spends $160B on Gold? Will It Hit 5K Next


Gold price today is down over 1.3%, while China's buying spree keeps setting records, the price is now sitting right on top of the major support zone that decides what comes next.
This Gold Price Prediction looks at whether gold hold $4,250 or $5,000 comes back into view or whether this pullback runs deeper first.
Market data checked on September 23, 2026
Gold News Today: China's Gold Buying Has Gone Parabolic
China's gold buying has gone parabolic, with the country spending nearly $160 billion on gold over the past 8 months even after prices hit an all-time high this year.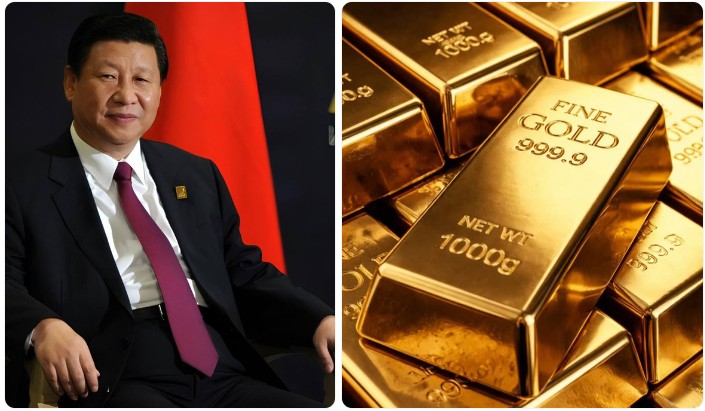
The post said Beijing favors gold as one of the safest places to park funds given it carries no counterparty risk, while domestic investors are turning to gold too as real estate, stocks, and bonds all offer weak returns, with China's 10-year bond yield sitting at just 1.67%.
Despite being the world's largest gold producer, China has reportedly imported more than 1,000 tonnes of gold this year, already surpassing its entire 2025 import volume.
CoinGabbar could not independently verify these figures, as no customs or central bank source was linked alongside the post.
Gold News: China Imports 1,141 Tonnes of Gold in 8 Months
A second social media post put a more specific figure on the story, reporting that China imported 1,141 tonnes of gold in the first 8 months of 2026, its largest import total on record for that period and already ahead of its full-year 2025 number.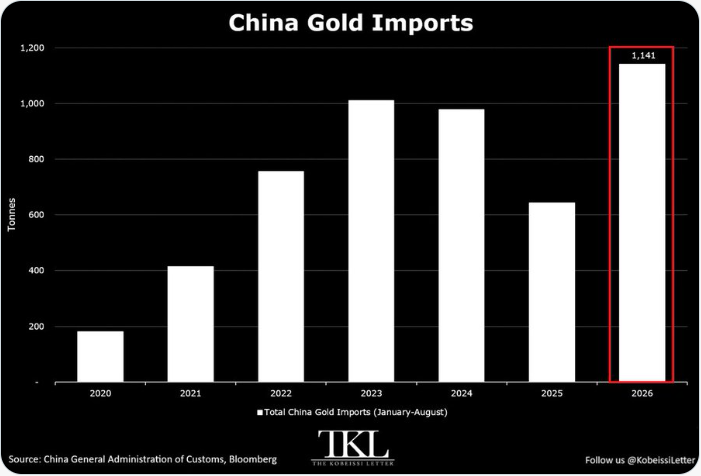
At the current pace, the post projected China's annual imports could surpass 1,700 tonnes for the first time, with Chinese gold ETFs adding 44 tonnes over the same 8 months, up 18% year over year.
The surge was attributed to strong investment demand, economic uncertainty, and a strong yuan making imports more favorable.
CoinGabbar could not independently verify these figures either, as no linked customs data accompanied the claim.
How the US Dollar Affects Gold Price
Gold is priced in dollars, so the two usually move in opposite directions: a stronger dollar makes gold price for other currency holders and softens demand, while a weaker dollar makes it cheaper and supportive.
A weaker dollar relative to the yuan is also part of why gold imports from abroad have looked more favorable for Chinese buyers.
How China Import News Affects Gold Price
China imported 1,141 tonnes of gold in the first 8 months of 2026, already ahead of its full 2025 total, plus another 44 tonnes into ETFs, despite being the world's largest gold producer.
With property, stocks, and bonds all offering weak returns at home, that demand looks like capital rotating into gold rather than a short-term trade, and it adds real physical buying that can support price during pullbacks like the current one.
How Crude Oil Affects Gold Price
Gold and crude oil often move together, since both are priced in dollars and both react to inflation expectations.
Rising oil prices tend to lift inflation expectations, pushing investors toward gold as a hedge, and a weaker dollar that lifts oil usually lifts gold too, since it makes both cheaper for holders of other currencies.
Gold Technical Analysis
Gold rallied from around $4,050 in early August to a high near $4,644 in early September, then reversed into a steady pullback that has carried price below both EMAs.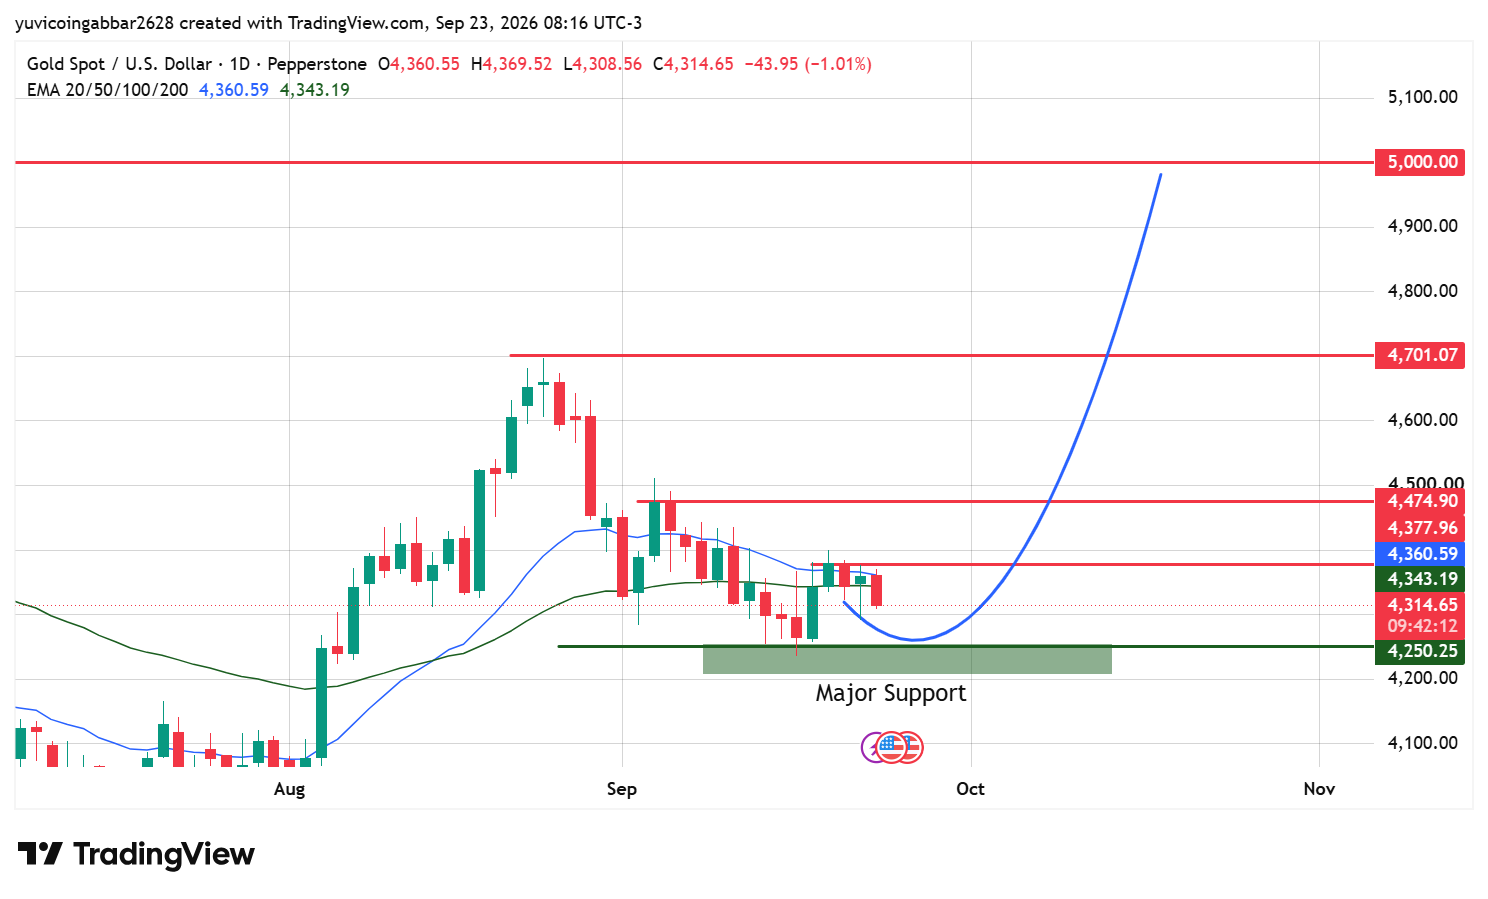
That decline has slowed just above the major support zone between roughly $4,200 and $4,270, with Gold Price Today trading 1.03% down right at the top of that zone.
Gold Forecast: What Could Happen Next?
Bull case: Holding the major support zone near $4,250 and reclaiming both EMAs would suggest the September pullback is stabilizing rather than turning into a deeper correction.
A confirmed close back above $4,475 would open the path toward $4,700, with China's record import pace adding a structural demand backdrop to any technical recovery.
Bear case: A close below $4,250 would break the major support zone and put the broader uptrend from August in doubt. A break below $4250 could take the price to the psychological level of $4,000.
That kind of breakdown would suggest the pullback from the early-September highs still has room to run, regardless of how strong reported import demand looks on paper.
Gold Price Prediction: Can Gold Reach $5,000?
If gold holds support near $4,250 and the Fed's interest rate stance is supportive, the price could see a sharp rally toward $5,000.
According to a Bloomberg report, gold prices are heading toward $5,000, as global gold ETF holdings have risen to 100 million ounces, near their highest level in nine months.
Gold ETF holdings have climbed by more than 4 million ounces since their July low, fully recovering the decline seen between April and July. Gold-backed ETFs have now logged eight straight days of inflows, the longest streak since October 2025.
Prices had tracked ETF holdings fairly closely until mid-August, so if price now catches up with this rise in holdings, it could push gold above $5,000 in the coming months, with investors clearly piling into gold funds at a faster pace.
Gold Price Prediction 2026: Expert Analysis
According to CoinGabbar analysts, the pullback from September's highs has been orderly rather than sharp, and price is now testing a support zone that has held on the chart before, which is a more constructive setup than a breakdown through fresh lows would be.
China's reported import numbers add a fundamental tailwind, but they're demand-side data points rather than a timing signal, so the $4,250.25 zone is the level that actually determines whether this pullback is done or not.
Disclaimer
This piece is for informational purposes only and isn't financial advice. The levels and scenarios above are based on technical chart analysis and publicly available data at the time of writing, and gold prices can move sharply on macro and currency news, so past patterns don't guarantee future outcomes. It's worth doing independent research and considering your own risk tolerance before acting on any of the levels discussed here.


















