Gold Price Prediction: XAU/USD Breakout Setup! $4,679 Next?


Gold is pulling back today, but the bigger picture still looks interesting. XAU/USD Gold Price Today is closed at $4,378.45, down 0.33% on the current candle, after breaking above the descending trendline that had capped it for weeks.
Momentum is quietly turning too, with RSI climbing back above the neutral 50 line. This gold price prediction looks at whether both signals together point toward a bigger move.
Market data checked on September 19, 2026.
Gold Price Today: Market Overview
Metric | Value |
Price | $4,378.45 |
24h Change | -0.3% |
Key Events to Watch This Week
A busy calendar is ahead, and several events could move gold from here (all times US Eastern):
Tuesday, Sep 22: ADP Weekly Employment Change, the Richmond Manufacturing Index, and speeches from Fed officials Williams, Jefferson, and Barkin, all landing through the evening.
Wednesday, Sep 23: Flash Manufacturing and Services PMI prints at 7:15pm give an early growth read, followed by Crude Oil Inventories at 8:00pm, relevant given oil's recent influence on inflation expectations.
Thursday, Sep 24: The most closely watched day. Unemployment Claims and Current Account data land at 6:00pm, followed by New Home Sales at 7:30pm, with Fed officials Williams, Hammack, and Paulson also speaking through the day.
Multiple Fed speeches are packed into this stretch, and with rate expectations already in focus, any hints on the pace of future moves could add volatility to gold either way.
Gold Forecast: XAU/USD Technical Analysis
Gold broke above its multi-week descending trendline a few days ago and is now retesting that breakout zone near $4,400. The EMA cluster just below, at $4,346.62 to $4,353.94, is acting as support during this pullback.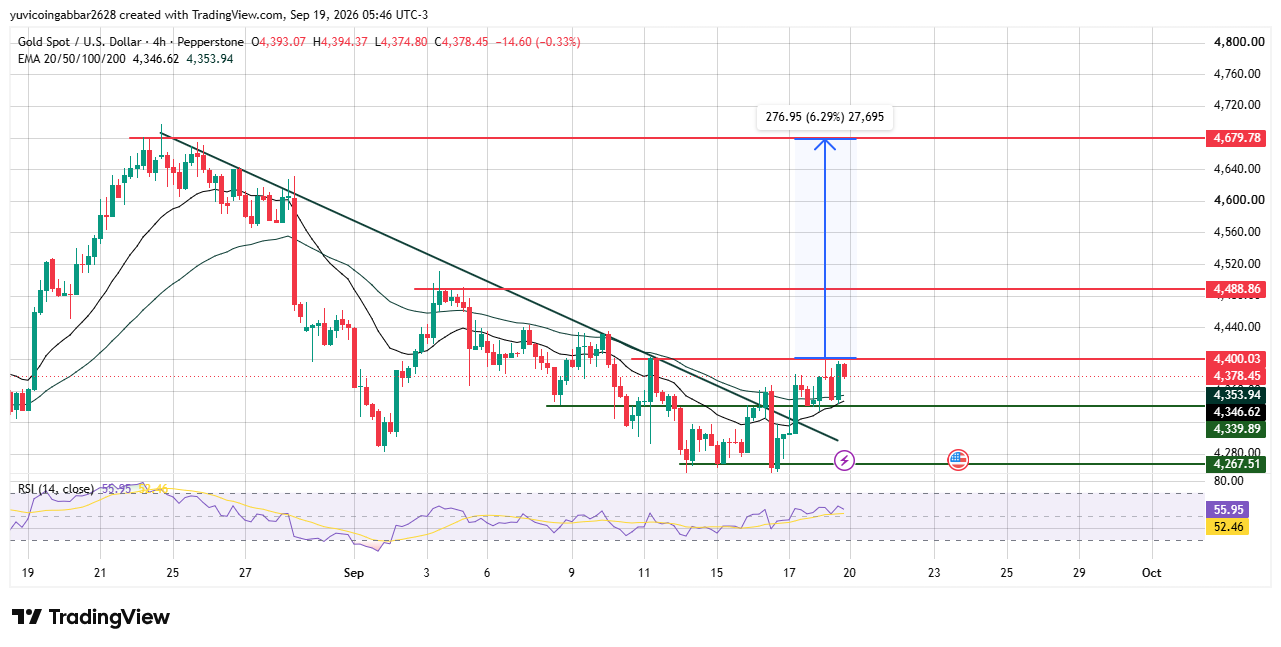
RSI, a momentum indicator that measures how fast and how far price has moved, is reading 55.95, above the neutral 50 mark but well short of the 70 level typically seen as overbought.
That leaves room for gold to keep climbing without looking stretched, which adds some weight to the bullish case here.
Gold Price Forecast: Support
$4,347 to $4,354 is the EMA zone to hold first. Below that, $4,339.89 is the next support, with $4,267.51 support marking a deeper structural floor further down.
Gold Price Outlook: Resistance
After clearing the $4,000 level, $4,488.86 is the nearest resistance standing in the way of a bigger move. Clear that, and the chart's own projection points to $4,679.78 as the next major target.
Gold Bullish Setup: What Confirms or Invalidates the Breakout?
Scenario | Trigger | Likely Outcome | Invalidation |
Breakout holds | Hold above $4,354, clear $4,488.86 | Push toward $4,679.78 | Close below $4,346.62 |
Range hold | Consolidate $4,347–$4,488 | Base before next move | Break below $4,267.51 |
Breakdown | Close below $4,339.89 | Slide toward $4,267.51 | Reclaim $4,353.94 |
Gold Price Prediction: Can Gold Reach $4,679?
It's the chart's own projected target if the trendline breakout holds and RSI keeps climbing without stalling out. Gold still needs to clear $4,488.86 first, a level it hasn't tested since breaking the trendline, before $4,679.78 becomes realistic.
Gold Price Prediction 2026: Expert View
According to CoinGabbar analysts, The trendline breakout and the RSI reading are telling a similar story right now: momentum has shifted, but it hasn't gone too far too fast. $4,488.86 is the level that will show whether this turns into a real breakout or just another retest that fades.
Disclaimer
This article is for informational purposes only and isn't financial advice. Gold and commodity markets can move sharply on macro news. Always do your own research before making any trading decisions.


















