Hedera Price Prediction: Why Did HBAR Drop 8%? IBM Deal In Focus

Hedera has quietly boxed itself into one of the most decision-forcing patterns on the charts right now, and the next move out of it could set the tone for HBAR over the coming days.
This Hedera price prediction walks through exactly what that setup looks like, what the enterprise side of the network has been doing, and which levels traders need on their radar before this triangle resolves.
Position disclosure: No personal position is held in HBAR. This is a purely technical and data-based read of the chart and market activity, not financial advice.
Hedera Price Today: Live Data
HBAR is priced at $0.09153, down 7.98% over the last 24 hours.
Futures volume for the period comes in at $206.56M against spot volume of $67.92M, showing derivatives are doing most of the heavy lifting in this move rather than direct spot buying. Market cap sits at $4.00B with open interest at $145.21M.
Circulating supply is 43.83B HBAR against a fixed max supply of 50.00B, with total supply already at 50.00B.
Source: CoinGlass, September 24, 2026
Hedera News Today
Crypto account ALLINCRYPTO flagged a genuinely large piece of Hedera latest news this week. 
The Hashgraph Group has become an IBM Silver Partner, and its Hedera-powered IDTrust platform is now officially listed on IBM Cloud.
That puts technology built directly on Hedera in front of IBM's global enterprise customer base, and IBM is not a small name to have in your corner; it is one of the biggest technology companies on the planet.
The post framed this as HBAR pushing deeper into enterprise adoption, and it is easy to see why that matters for the long-term Hedera trend beyond just this week's chart.
Source: X (@RealAllInCrypto), September 23, 2026
Quick Take
CMP: $0.09142 (1h chart)
Bullish trigger: close above $0.10137
Bearish trigger: close below $0.08831
Data snapshot: September 24, 2026
Risk note: HBAR is down nearly 8% in 24 hours, so the triangle could resolve fast in either direction
Hedera Price Prediction 2026 Technical Analysis
The 1h HBAR/USDT perpetual chart on Binance shows Hedera coming down hard from around $0.102, a drop steep enough to trigger two separate Bear signals on the momentum indicator along the way, which now reads 43.78. 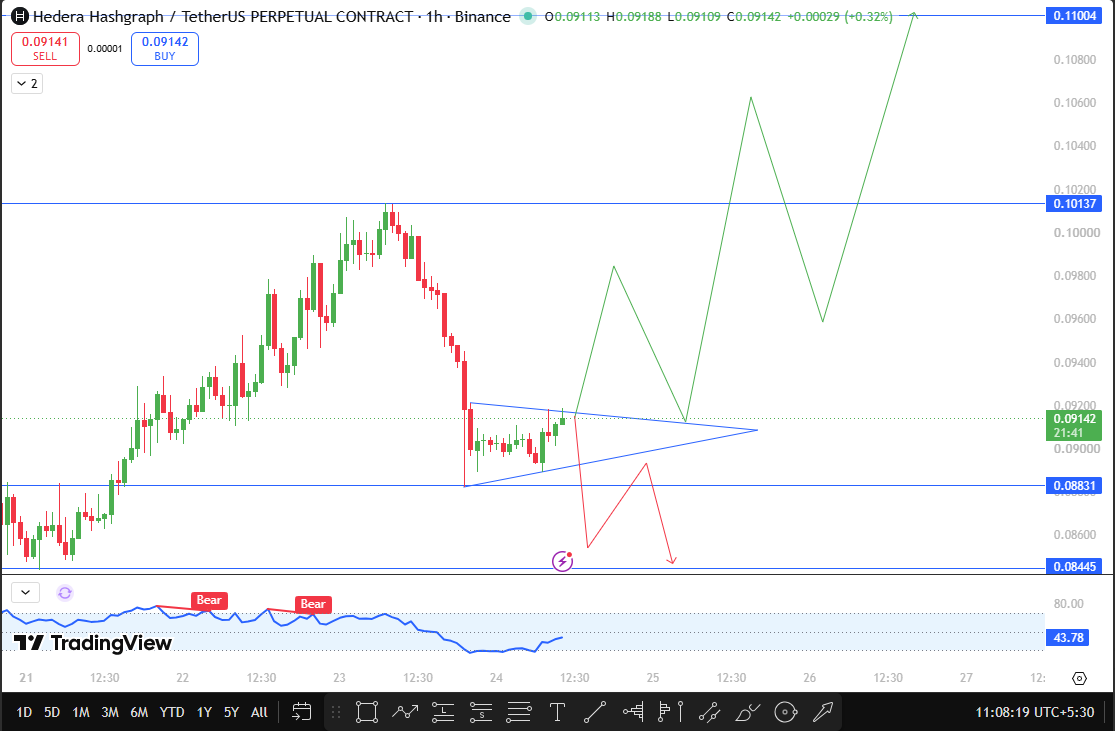
But instead of continuing to bleed, price has spent the last stretch of candles compressing into a symmetrical triangle, with lower highs and higher lows squeezing toward a single point.
That kind of pattern does not tell you direction on its own; it tells you that a decision is coming, and usually a sharp one once it arrives.
For this Hedera technical analysis, the triangle boundaries line up neatly with the levels that matter most right now.
An hourly close above $0.10137 would break the top of the triangle and flip HBAR back into bullish territory, with $0.11004 sitting as the next resistance to test if that breakout has real follow-through.
Go the other way, and an hourly close below $0.08831 breaks the bottom of the triangle, confirming near-term bearish continuation and putting $0.08445 in play as the next support zone.
Until one of those two levels gives way, HBAR is essentially in a holding pattern, and the IBM partnership news gives bulls a fundamental reason to want the upside break rather than the downside one.
Chart: TradingView, Hedera Hashgraph/TetherUS Perpetual, 1h Binance, September 24, 2026
HBAR Support and Resistance Levels
Level Type | Price | Distance from CMP |
Resistance 2 | $0.11004 | +20.4% |
Resistance 1 | $0.10137 | +10.9% |
Current Price | $0.09142 | — |
Support 1 | $0.08831 | -3.4% |
Support 2 | $0.08445 | -7.6% |
Bull, Base, and Bear Case
The bullish path for this HBAR price prediction plays out if buyers defend the triangle's lower boundary and eventually push an hourly close above $0.10137, at which point $0.11004 becomes the next logical target, backed by the IBM enterprise angle giving bulls a story to lean on.
The base case, and arguably the most likely outcome for the next few hours, is HBAR continuing to chop inside the narrowing triangle as both sides wait for a clean signal, with the range tightening further the closer price gets to the apex.
The bear case shows up if sellers force an hourly close below $0.08831, which would confirm the breakdown and open the door toward $0.08445, undoing the recent stabilization entirely.
Risks to Watch
HBAR's derivatives-heavy volume profile, with futures activity roughly three times spot volume, means this triangle could break on thin conviction and reverse quickly once leveraged positions get squeezed.
Broader market direction, particularly how Bitcoin trades over the next day or two, will likely have more influence on which way HBAR breaks than the IBM news alone, and any pullback in that enterprise partnership narrative would remove one of the stronger bullish arguments currently on the table.
HBAR 2030 Price Outlook
By 2030, Hedera's outcome will largely track how far its enterprise partnerships actually go beyond headlines.
The IBM Cloud listing for its IDTrust platform is the kind of relationship that, if it converts into real enterprise usage rather than staying a branding win, could meaningfully widen HBAR's addressable market in identity and trust infrastructure.
That would matter more for HBAR's long-run value than any single technical breakout, since enterprise contracts tend to build slowly but stick once they are signed.
Glossary
Symmetrical triangle: A consolidation pattern formed by converging trendlines of lower highs and higher lows, typically resolving in a sharp breakout.
Open interest: The total value of outstanding derivative contracts on an asset that remain unsettled.
Breakout: A decisive move beyond a chart pattern's boundary, often signaling the start of a fresh trend.
Apex: The point where a triangle pattern's converging trendlines meet, after which a breakout typically occurs.
Disclaimer
This article is for informational purposes only and does not constitute financial advice. Cryptocurrency markets are highly volatile, and any trading or investment decisions should be made after conducting independent research.

















