Why Is Hedera Trending? HBAR Global Expansion News Meets $0.50

Hedera is sitting at a spot on the weekly chart that has decided the fate of countless breakout attempts before, and this time the setup looks genuinely different.
HBAR has climbed straight into a multi-year resistance line, and instead of getting rejected the way it has so many times in the past, price is actually holding its ground there, sparking fresh Hedera price prediction interest across the community.
If this level finally gives way, the scale of the move that could follow is the part that has traders paying close attention.
This is a purely technical and data-driven read of the Hedera Weekly chart and current market conditions. It reflects no personal position in HBAR and should not be treated as financial advice.
Hedera Price Today: Live Data and Forecast
HBAR is currently trading at 0.07901, up 3.84% over the past 24 hours.
Futures volume over the last day sits at 146.20 million dollars, while spot volume is 34.64 million dollars, showing a healthy mix of leveraged and spot activity around this move.
Market cap stands at 3.46 billion dollars with open interest at 123.03 million dollars.
Circulating supply and total supply are both at 43.83 billion out of a 50.00 billion max supply, meaning the vast majority of HBAR that will ever exist is already in circulation.
Source: CoinGlass, September 19, 2026.
Hedera Latest News: HBAR Price Prediction Backdrop
The Hedera news today is less about price and more about grassroots growth.
A post from ALLINCRYPTO on X highlighted the success of Hedera's Community and Ambassador Programs, noting that these initiatives are now active across the world, with particularly strong traction in Mexico, Colombia, Argentina, and Brazil.
The post also pointed out that Hedera is now eyeing expansion into the United States and Africa as the HBAR community continues to grow globally.
This kind of organic, community-driven expansion tends to build a steadier long-term base of support for a network compared to short-lived hype cycles, and it fits into the broader Hedera price forecast narrative as a sign of sustained ecosystem growth.
Source: ALLINCRYPTO on X, September 18, 2026.
Quick Take
CMP: 0.07899 on the Binance HBAR/USDT perpetual 1W chart
Bullish trigger: weekly close above 0.10972 opens the path to 0.40133 and 0.57765
Bearish trigger: weekly close below 0.06340 shifts focus to 0.04273
Data timestamp: chart and market data as of September 19, 2026, 12:40 IST
Risk note: this is a weekly chart setup, so confirmation takes time and false intraday moves above or below key levels should not be treated as valid signals
Hedera Technical Analysis: HBAR Price Target Setup
Zooming out to the weekly Hedera chart on Binance reveals a structure that has been building for years. 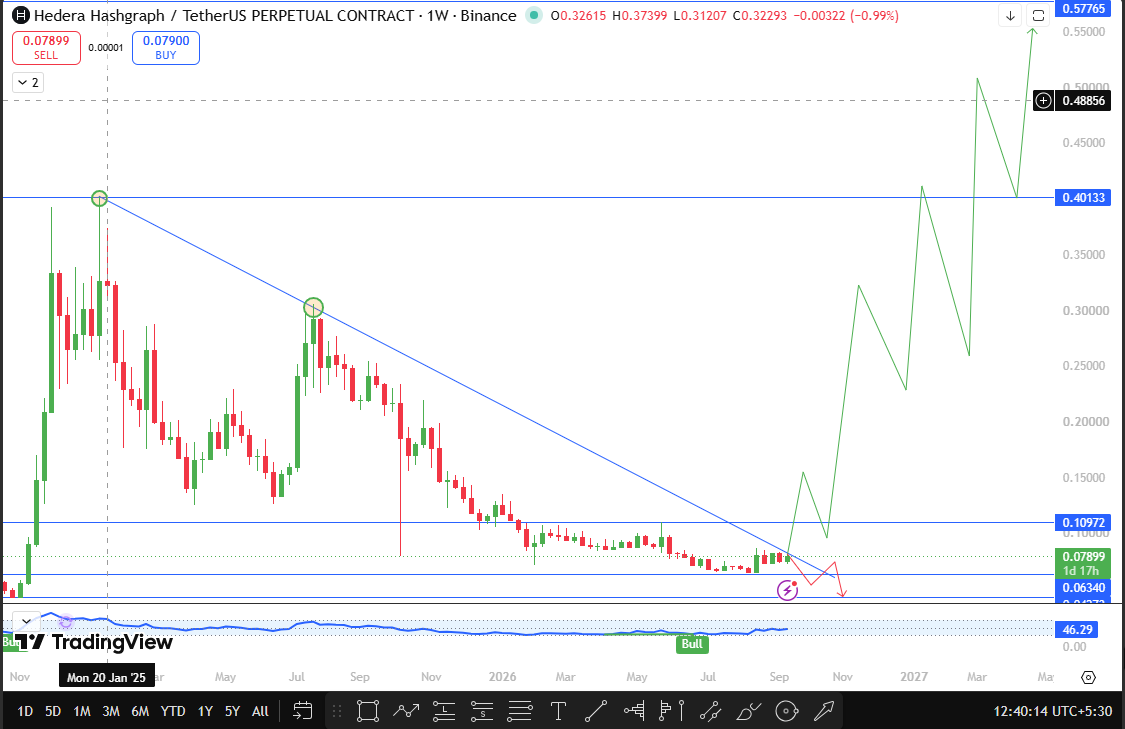
A descending trendline connecting the major swing highs has capped nearly every rally attempt since the last major top, and price has spent a long stretch grinding sideways well below it.
What makes the current picture interesting is that HBAR has now pushed directly into that trendline and is actually sustaining there rather than immediately reversing, which is a meaningfully different behavior compared to prior tests of this same resistance.
Momentum on the weekly chart carries a labeled Bull signal with a reading of 46.29, suggesting momentum is building but has not yet reached an extreme, leaving room for continuation if buyers stay committed.
The price is currently sitting at 0.07899, and the level that matters most from here is 0.10972. A weekly close above that level would represent a genuine break of the multi-year descending trendline, and given how significant that structure has been, confirmation here would carry real weight in any Hedera price prediction going forward.
If HBAR does manage that weekly close above 0.10972, the next major resistance sits at 0.40133, a level that would represent an enormous move from the current price.
Beyond that, 0.57765 comes into play as an even more ambitious target, one that could potentially put HBAR within reach of a new all-time high.
It is worth being clear that a move of this scale would likely unfold over many weeks or months rather than quickly, so this belongs firmly in the long horizon part of this Hedera technical analysis.
On the downside, 0.06340 is the level currently protecting the setup. As long as HBAR holds above it, the trendline test remains a live and valid bullish structure.
A weekly close below that level would suggest the resistance held once again, and from there the next support for the market to test would be 0.04273.
Support and Resistance Levels
Level Type | Price | Distance from CMP (0.07899) |
Resistance 2 (potential new ATH) | 0.57765 | +631.3% |
Resistance 1 | 0.40133 | +408.1% |
Trendline breakout trigger | 0.10972 | +38.9% |
Current Price | 0.07899 | — |
Support 1 | 0.06340 | -19.7% |
Support 2 | 0.04273 | -45.9% |
Bull, Base, and Bear Scenarios
In the bullish scenario, HBAR continues to sustain at the weekly trendline and eventually closes a week above 0.10972.
That kind of confirmation on a multi-year resistance structure would likely be seen as a major technical event, drawing renewed long-term interest and setting the stage for an extended move toward 0.40133 and, further out, the potential new all-time high near 0.57765.
The base case, and quite a plausible one given how significant this trendline has been historically, sees HBAR spending several weeks chopping around the current resistance zone as it tries to build enough conviction to break through decisively.
Repeated tests of a level this significant are common before an actual breakout, and the community growth story around the Ambassador Program could help support price during this consolidation phase.
The bearish scenario would involve HBAR getting rejected once again at this trendline, eventually closing a week below 0.06340.
That outcome would suggest the multi-year resistance has held its ground yet again, and sellers would likely aim to push the price down toward the 0.04273 support zone from there.
Risks to Watch
Because this setup is based on a weekly chart, confirmation naturally takes longer than an intraday or 4-hour setup, and traders acting on daily or hourly moves above or below these levels risk reacting to noise rather than a real signal.
The scale of the upside targets here, particularly 0.40133 and 0.57765, are historically significant levels that HBAR has struggled to reclaim for years, so treating them as near-term expectations rather than long-horizon possibilities would be a mistake.
Broader crypto market conditions also remain a factor, since a shift in overall risk sentiment could easily disrupt even a well-supported technical setup like this one.
Glossary
Descending trendline: A line connecting a series of lower highs, often used to identify resistance during a downtrend.
Weekly close: The final price at which an asset trades before the weekly candle finishes, often used to confirm major long-term breakouts.
Open interest: The total number of outstanding derivative contracts that have not been settled, reflecting active leveraged positioning.
All-time high (ATH): The highest price an asset has ever reached since it began trading.
Disclaimer
This article is for informational purposes only and does not constitute financial advice. Cryptocurrency markets are highly volatile, and readers should conduct their own research before making any investment decisions.


















