PAX Gold Price Prediction: Will Bullish Crossover Send PAXG New Highs?


PAX Gold just flashed two bullish signals at once. PAXG is trading at $4,364.72, down slightly today, but that's almost beside the point: price already broke above a multi-week descending trendline, and EMAs just crossed on the chart, an analyst called a bullish crossover.
This PAX Gold Price Prediction breaks down what both signals mean and the levels standing between here and a bigger move.
Market data checked on September 19, 2026.
What Is PAX Gold (PAXG)?
PAX Gold is a crypto token backed 1:1 by physical gold held in professional vaults, meaning each PAXG represents ownership of one fine troy ounce of gold. It lets people trade and hold gold exposure on the blockchain instead of buying physical bars or coins.
PAX Gold Outlook: Gold Technical Analysis
PAXG had been sliding inside a descending trendline since late August, making lower highs the whole way down. Around September 17 to 19, the price broke above that trendline and is now consolidating in a tight range near $4,364 to $4,400. 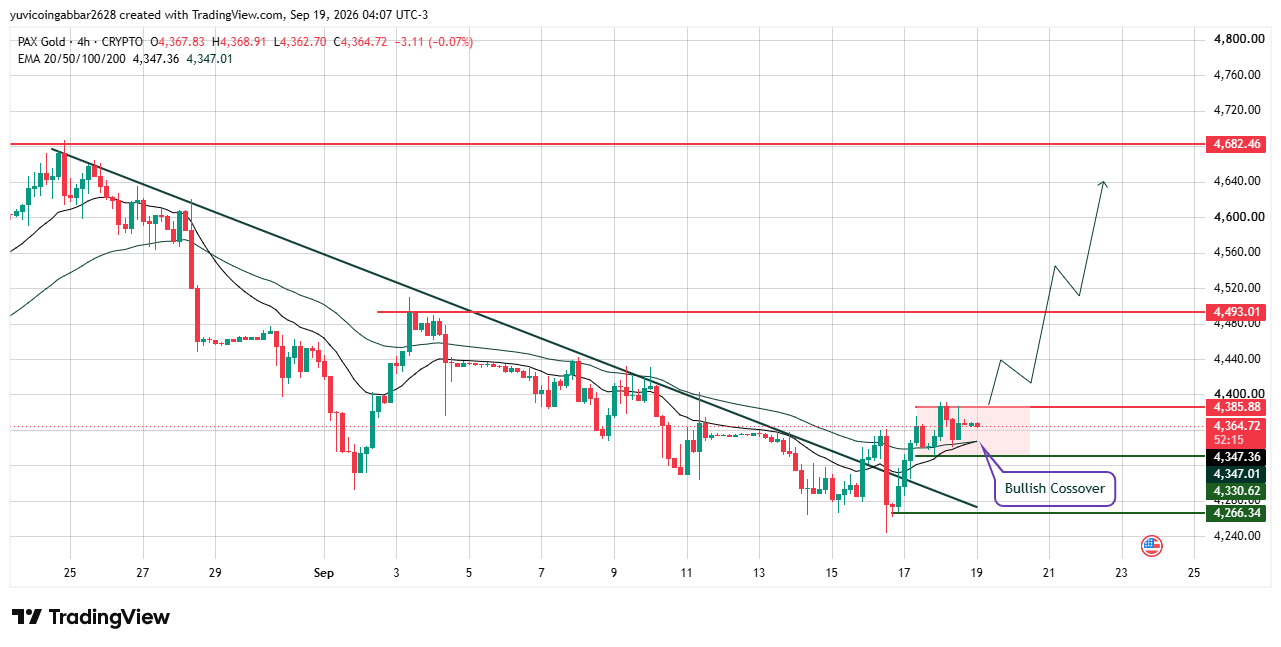
The bullish crossover has just occurred between the 20 EMA at $4,347.36 and the 50 EMA at $4,347.01. This is a bullish sign on the chart shows that the short-term momentum may be turning positive. The crossover gives bulls more confidence if PAXG holds above this EMA zone. If the price stays above $4,347, the setup could support further upside toward the next resistance levels.
If PAX Gold holds above this crossover zone and clears near consolidation, then $4,493.01 and then the next projected path on the chart points toward $4,682.46.
Losing the crossover zone instead would put the recent trendline break in question, with $4,330.62 and $4,266.34 as the next support levels below.
PAX Gold Price Forecast: Support
$4,347 is the level to watch first; it's both the crossover zone and the closest support beneath the price. If that breaks, $4,330.62 is the next spot buyers could step in, followed by $4,266.34 further down.
PAX Gold Price Outlook: Resistance
$4,493.01 is the nearest resistance and the one standing between here and a bigger move. Above that, $4,682.46 is the chart's bigger target if the breakout keeps going.
PAX Gold Price Prediction: Triggers and Invalidation
Scenario | Trigger | Likely Outcome | Invalidation |
Breakout confirms | Hold above $4,347, clear $4,493.01 | Push toward $4,682.46 | Close below $4,347.01 |
Range hold | Consolidate $4,347–$4,493 | Base before next move | Break below $4,330.62 |
Breakdown | Close below $4,330.62 | Slide toward $4,266.34 | Reclaim $4,347.36 |
PAXG Price Prediction: Can PAX Gold Reach $4,682?
It's the chart's projected target if both the trendline breakout and the bullish crossover hold. PAXG would first need to clear $4,493.01, a level it hasn't tested yet since breaking the trendline, before $4,682.46 becomes realistic.
PAX Gold Price Prediction 2026: Expert View
According to CoinGabbar analysts, two technical signals lining up at once, the trendline break and the bullish cross, make this a setup worth watching rather than dismissing.
$4,347 is the level that decides it: holding there keeps both signals intact, while losing it would suggest the cross came too early.
Disclaimer
This article is for informational purposes only and isn't financial advice. Crypto and gold-backed token markets can move sharply. Always do your own research before making any trading decisions involving PAXG.


















