MarsCat Price Prediction 2027: How High Can $MCAT Go?


A fresh token rarely gets a clean forecast, and MCAT is no exception. MarsCat price prediction 2027 work has to start from a hard fact: this token's trading history spans weeks, not years. Readers who tracked the MarsCat 2026 rally trap breakdown already know how fast the coin can swing.
Other trackers don't agree with each other either. CoinDataFlow-style models sit near $0.12 to $0.35 for 2027, while MEXC and Coinbase-style assumptions land closer to $0.41. That gap says something on its own. Scenario thinking fits this asset better than one confident number.
MarsCat Price Today and Current Market Setup
As of 02:46 UTC on September 18, 2026, MCAT trades near $0.9349, up 277.7% across 24 hours, according to CoinGecko's live MCAT data.
The 24-hour range runs from $0.2461 to $0.9833. Market cap sits at $706.165 million, and fully diluted valuation matches it, since supply is already fully circulating.
24-hour trading volume reads $17.199 million. Circulating, total, and max supply all show 1,000,000,000 MCAT. All-time high: $0.9833, hit minutes before this snapshot. All-time low: $0.217, set two days earlier.
What Is Driving MarsCat Price Right Now?
Momentum, mostly. And thin trading history that makes any pattern easy to break.
MCAT Trading History Is Still Very Short
A coin with two weeks of trades doesn't carry the same weight as one with two years of them. Fibonacci extensions are already drawn on the MarsCat price prediction hub assume a trend structure that's barely had time to prove itself. Patterns can form fast here. They can also collapse just as fast.
Liquidity and Whale Concentration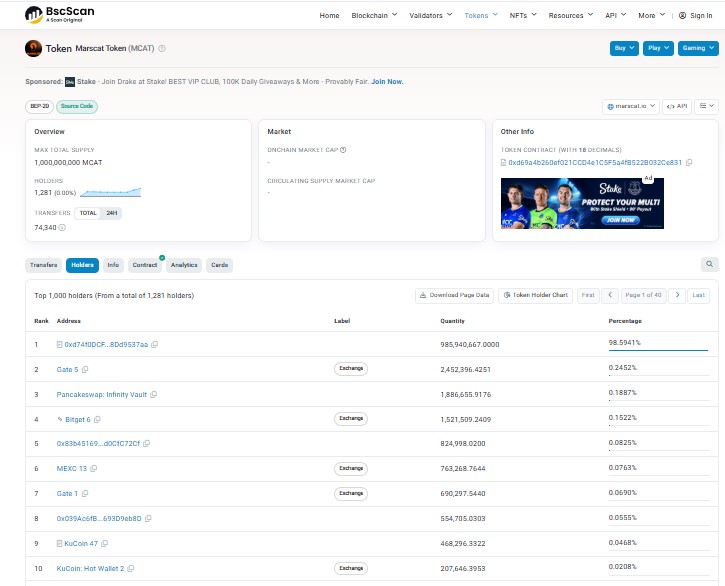
One wallet holds 98.59% of the total MCAT supply, per BscScan's holder data. That's not a small detail.
A single address moving even a fraction of that stake could crush the order book. Liquidity looks thin against that kind of concentration. Traders should treat every rally with that number in mind.
MarsCat Technical Analysis for 2027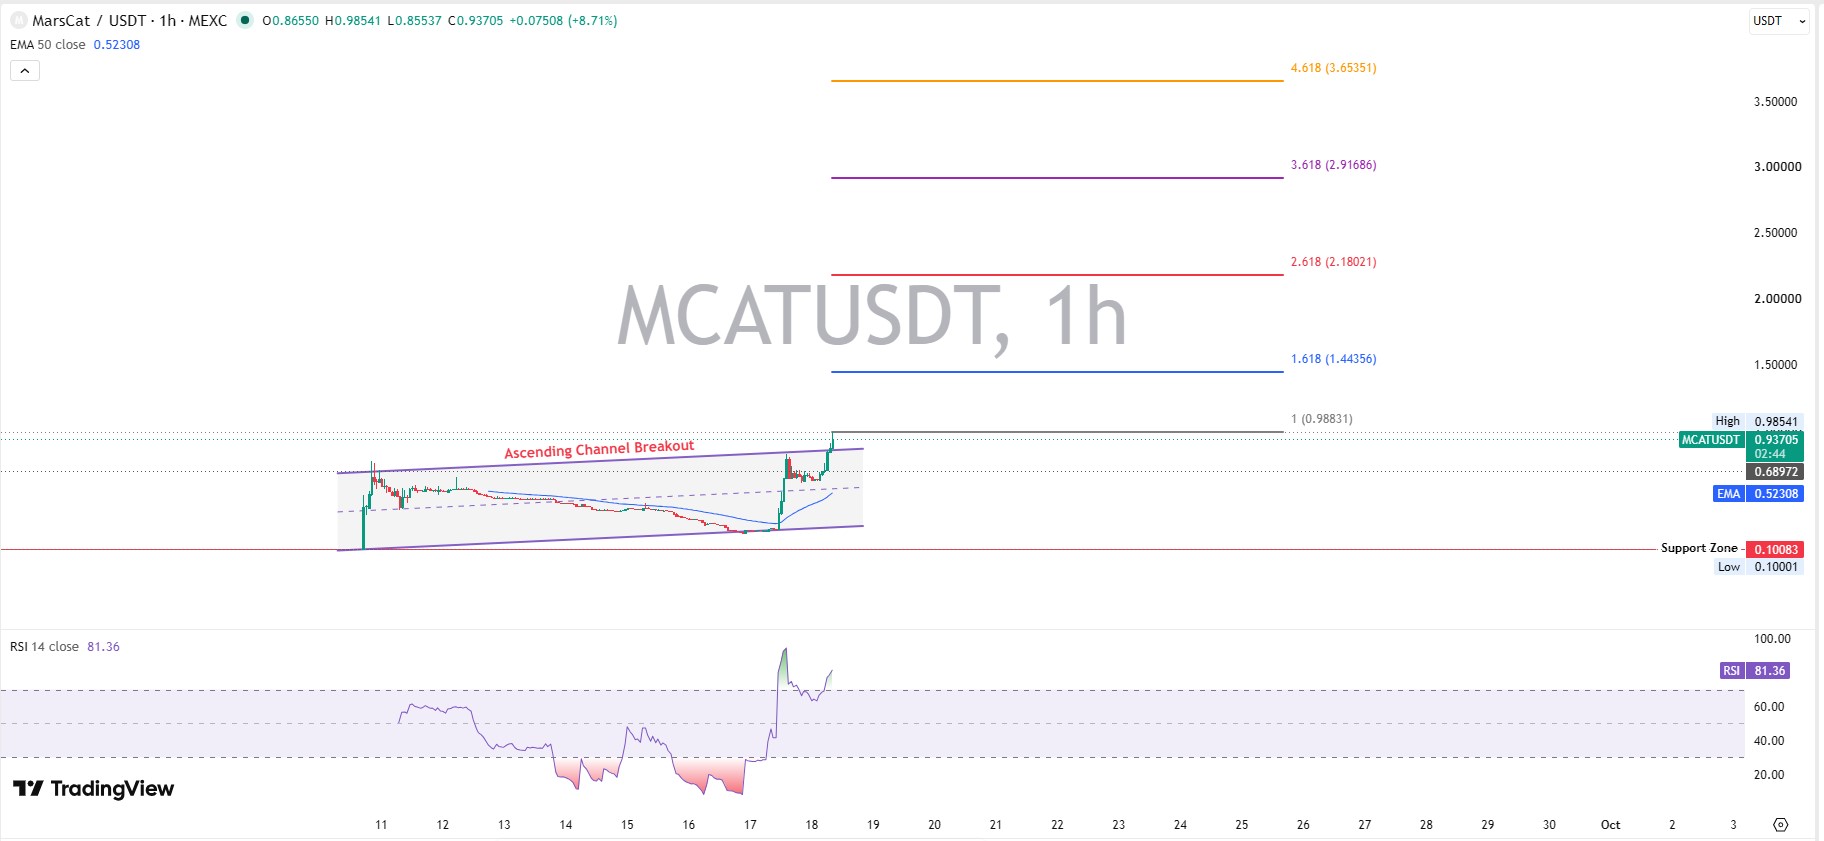
MCAT Trend and Momentum
The 1-hour chart shows an ascending channel breakout, with trading pushing from roughly $0.10 toward $0.98 inside two weeks. On the 1-day view, the structure still reads as an early-stage markup phase. On the 1-week view, there isn't enough data yet to call a real trend. That's just the truth of a new listing. The full MCAT chart on TradingView shows the breakout structure in real time.
RSI and MACD Signals
RSI 14 reads 81.36. That's deep into overbought territory, above the standard 70 line. Momentum is stretched, not broken.
MACD sits at 0.1128, above the signal line at 0.0952, with a positive histogram of 0.0176. That's a bullish crossover, still active. No bearish divergence has shown up yet, but there hasn't been enough price history for divergence to mean much anyway. Confirmation needs sustained trading above resistance, not just one green candle.
Key Support Levels
The deepest support zone sits between $0.10083 and $0.10001, the base before the breakout began. A secondary, more dynamic support runs near the 50-period EMA at $0.52308. A tighter zone sits around $0.68972, the level trading opened from before the latest push.
Key Resistance Levels
Immediate resistance is the all-time high near $0.9833. Above that, Fibonacci extensions plotted on the chart mark $1.44356 (1.618), $2.18021 (2.618), $3.61686 (3.618), and $3.65351 (4.618) as the next mapped levels.
Breakout and Breakdown Scenarios
A confirmed breakout needs multiple trading sessions holding above $0.98, not a single wick. Volume has to expand alongside it, not fade. And RSI needs to cool from 81 without a hard reversal. Miss any of that, and the move risks turning into a breakdown back toward the EMA zone.
MarsCat Price Prediction 2027
Bull Case
Target range: $1.44 to $2.18. This needs a confirmed breakout above the all-time high, daily volume holding above $20 million, fresh exchange listings, and a broader crypto market in an uptrend. Invalidation: a drop back under the $0.52 EMA support.
Base Case
Expected range: $0.45 to $0.95. This assumes consolidation, gradual ecosystem growth, and no major shock in either direction. Normal, choppy market conditions apply here, not a breakout and not a collapse.
Bear Case
Downside range: $0.10 to $0.25. This plays out if the $0.52 support fails, liquidity thins further, and broader crypto markets weaken at the same time. The bearish thesis gets invalidated if trading reclaims and holds above $0.68972.
MarsCat 2027 Price Target Scenarios
Scenario | 2027 Range | Main Conditions | Invalidation |
Bear | $0.10–$0.25 | Support failure + weak liquidity | Recovery above $0.52 |
Base | $0.45–$0.95 | Consolidation + gradual adoption | Sustained loss of $0.45 |
Bull | $1.44–$2.18 | Breakout + volume + ecosystem catalysts | Failed breakout above $0.98 |
Can MarsCat Reach $1 in 2027?
The math here is simple. Required market cap equals MCAT price multiplied by circulating supply, and circulating supply is fixed at one billion tokens.
A $0.50 valuation implies a $500 million market cap. A $1 valuation implies a $1 billion market cap. A $2 valuation implies $2 billion.
The current market cap already sits at $706.165 million with trading near $0.93. So $1 isn't some distant fantasy number. It's roughly seven percent above where trading sits right now.
Does that make $1 realistic for 2027, or is it just a rounding error away from where the coin already trades today?
Either way, the gap between "$1 is easy" and "$1 holds" is enormous. Reaching a level and staying above it aren't the same thing.
What Could Push MCAT Higher in 2027?
Exchange Listings and Liquidity
MarsCat's team announced a MEXC Airdrop+ event running Sep 17, 2026, 12:00 UTC through Sep 24, 2026, 12:00 UTC, offering 300,000 MCAT and 10,000 USDT to participants. Events like that can pull in fresh trading volume, at least in the short term.
Fresh entries on tracked exchange listings tend to matter more for a young token like this than for an established one, since deeper order books directly ease the whale-concentration risk noted above.
MarsCat Ecosystem Growth
The project frames itself as a privacy-first Web3 super app, tying wallet activity, social features, and AI tools into one place. If that ships as described, it could support demand beyond pure speculation. Broader AI-linked crypto developments shape how much attention this kind of positioning gets from traders.
New Partnerships or Product Releases
Any confirmed partnership or product launch would need to bring real usage, not just a headline, to move the needle for 2027 targets. Checking the upcoming crypto events calendar is a simple way to catch announcements before they hit the broader news cycle.
Broader Meme/AI/DeFi Market Sentiment
MCAT sits at the intersection of meme-coin energy and AI-branded positioning. Sentiment across both categories matters more than MCAT's own fundamentals right now. Recent memecoin market news gives a sense of whether risk appetite is rising or fading across the wider category.
Bitcoin and Overall Crypto Market Direction
A rising Bitcoin tends to lift smaller-cap tokens with it. A falling Bitcoin tends to hit thin-liquidity coins hardest. The MCAT would not be an exception either way.
What Could Push MarsCat Lower?
Liquidity Risk
Thin order books mean even moderate sell pressure can move the price sharply.
Whale Selling
With one address controlling 98.59% of supply, any distribution from that wallet is the single biggest risk on this chart.
Failed Breakout
A rejection at the $0.98 all-time high, without volume follow-through, would likely send trading back toward the EMA support fast.
Broader Crypto Market Weakness
A market-wide downturn rarely spares low-cap, high-volatility names.
Loss of Major Support
A break below $0.52, and then below the $0.10 zone, would undo most of the bullish structure built since the breakout began.
MarsCat Price Prediction 2027: What Traders Should Watch
Tracking active ongoing airdrop campaigns alongside these signals rounds out the picture, since incentive events often precede short-term volume spikes.
Break above the $0.9833 resistance, confirmed over multiple sessions
Volume expansion alongside any new high
Higher-high, higher-low structure holding on the daily chart
RSI cooling from overbought without a sharp reversal
MACD staying above the signal line
Bitcoin's broader trend direction
Exchange liquidity depth, not just listing announcements
Any movement from the top whale wallet
Whether the $0.52 support zone holds under pressure
Disclaimer
This article is for informational purposes only and does not constitute financial, investment, or trading advice. Cryptocurrency markets, and especially new, thinly-traded, and highly concentrated tokens like MCAT carry extreme volatility and risk, including the risk of total loss.


















