SpaceX Stock: Could Two September Events Push SPCX Price Toward $180?


SPCX Stock Forecast: Can SPCX Reclaim $155 Before Flight 14?
SpaceX stock is back in the spotlight this week. Shares of Space Exploration Technologies Corp (SPCX) rose 2.60% on Thursday, closing near $154.81 and pushing the company's market cap above $2 trillion.
The move came even after SpaceX pushed back its Starship test flight, showing that traders are watching more than just the rocket schedule right now.
This SpaceX stock price prediction looks at the chart, the Starship delay, the upcoming share unlock, and the AI business that is now driving a big part of the story.
What Is The SpaceX Stock Price Today
SPCX closed at $154.81, up 2.60% on the day. The stock touched an intraday high of $156.87 and a low of $152.63. In the after-hours session, shares traded slightly higher near the $155 mark.
The stock is well above its SpaceX IPO price of $135, but still far below its post-IPO peak of $225.64, hit just days after going public. SPCX stock price has also rebounded by more than 47% since hitting its all-time low near $104.83.
Metric | Value |
Last Price | $154.81 |
Daily Change | +2.60% |
Day Range | $152.63 - $156.87 |
52-Week Range | $104.83 - $225.64 |
Market Cap | $2.041 Trillion |
SpaceX IPO Price | $135 |
PE Ratio (TTM) | -- |
EPS (TTM) | -$1.13 |
Forward Dividend & Yield | -- |
Ex-Dividend Date | -- |
Earnings Date (est.) | Nov 3, 2026 |
1-Year Target Est. | $222.42 |
Analyst Price Target (Morgan Stanley) | $300 |
SpaceX stock price does not carry a PE ratio right now since the company is not yet profitable, and EPS (TTM) sits at -$1.13. There is no dividend on SPCX stock at this stage, which is normal for a newly listed growth company.
Why Did SpaceX Stock Rise This Week
The gain was not really about the rocket. Reports about SpaceX ramping up its AI computing business gave the stock a fresh push, according to Barron's, and that has been the main story behind the shares in recent weeks.
Morgan Stanley has kept an Overweight rating on the stock with a $300 price target, pointing to growth in Starlink and the AI compute buildout as reasons to stay bullish.
Wall Street's own AI revenue numbers for SpaceX have jumped fast. 2027 AI revenue estimates moved from around $38 billion in June to about $67 billion now.
The 2030 estimate has gone from roughly $110 billion to close to $275 billion over the same period.
Why Was Starship Flight 14 Delayed?
SpaceX moved the 14th Starship test flight from September 22 to September 28. This is not the first change this month either, since the date had already shifted from September 18 to September 22 before this latest push.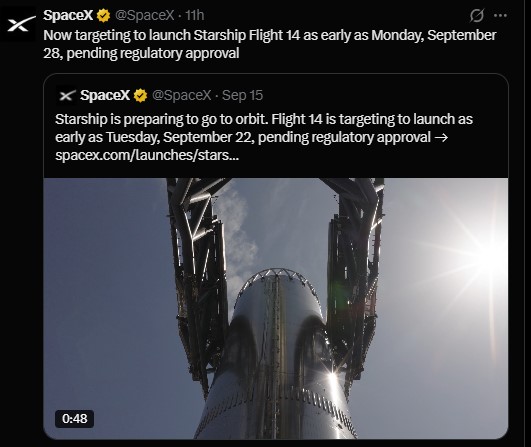
SpaceX has never reached orbit with Starship before, so waiting for the right conditions is not unusual. Reaching orbit is also the step that opens the door to making Starship fully and rapidly reusable, which is the long-term goal.
Starship Flight 14 is aimed at reaching a stable Earth orbit and deploying the first batch of Starlink V3 satellites. Elon Musk has also talked about a much bigger picture for Starship, describing a plan where the system could eventually carry Falcon's current annual payload of about 2,500 tons up to over 1 million tons, and possibly as high as 10 million tons per year in orbit over time.
When Is The SpaceX Stock Unlock Date?
Here is the part getting less attention. A scheduled lock-up release is expected on September 24, which frees up another batch of shares for possible sale.
Under the old timeline, the launch would have come first, giving holders a reason to stay in the stock if the flight succeeded. Now the unlock lands four days before the launch, while the outcome is still unknown. That order matters for short-term price swings around SPCX stock.
This SpaceX share unlock is worth watching closely. A bigger float does not guarantee selling pressure, but markets tend to price in the risk of it ahead of time, which is part of why SpaceX stock price action has been choppy near $155 this month.
What Is The SPCX Stock Price Prediction Right Now?
Based on the 4-hour chart, SPCX stock is forming a pattern of higher lows since the August bottom, while price keeps testing resistance in the $154 to $155 zone.
Upside levels:
A close above $155-156 with strong volume could open the door to $165.24 (0.5 Fibonacci level)
Beyond that, $180 (0.618 Fibonacci level) is the next zone traders are watching
Downside levels:
$150.98 is the first support level to hold
The $144 to $148 zone is a broader rising support area
A break below that could expose $133.34
The RSI is sitting around 61, which leans bullish but is not yet in overbought territory. Some traders following the SPCX stock chart also see this as a bull flag breakout that could aim for $171-172 first, with a shot at $230-240 by year-end if momentum holds.
This is a technical read of the chart, not a guaranteed price prediction. The $155 level remains the line in the sand for this SpaceX stock price prediction right now.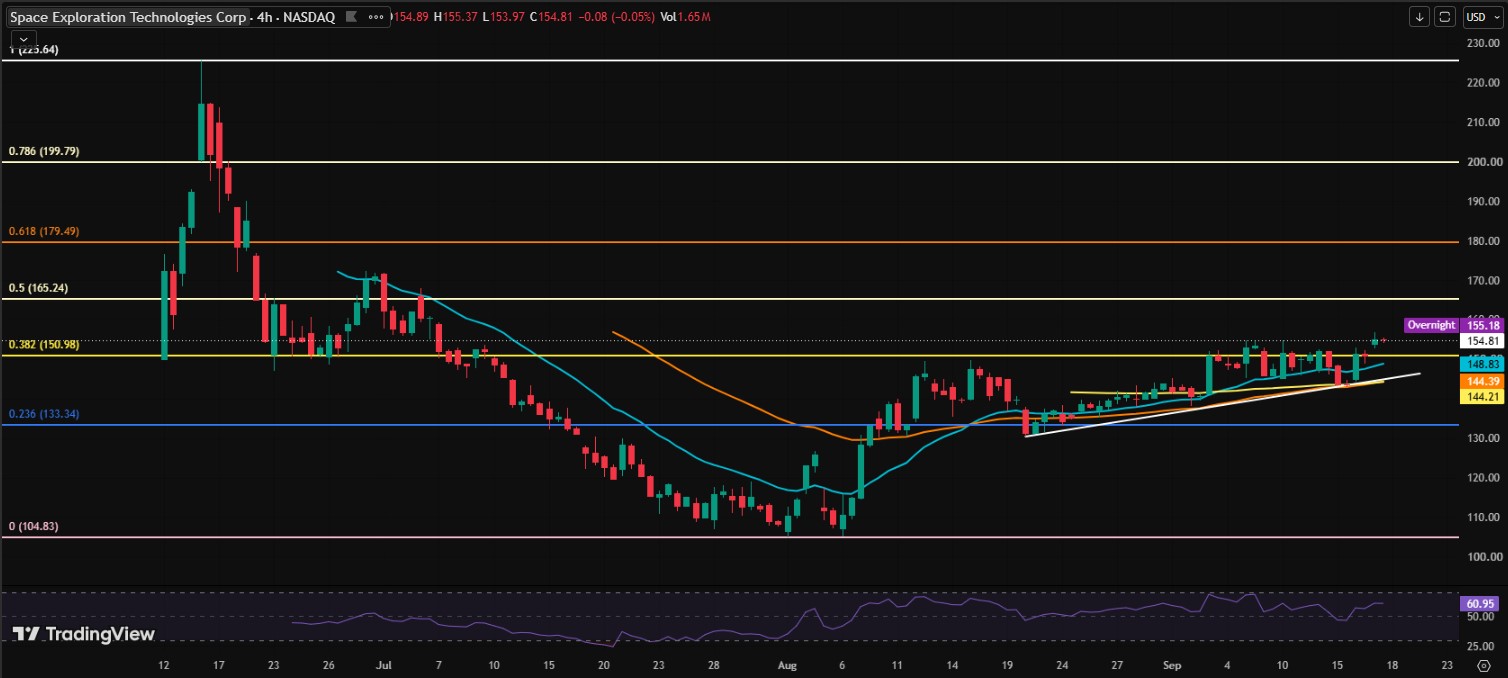
What's The Latest SpaceX Stock News?
SpaceX is also building a chip-making facility with Tesla in Austin, Texas, aiming to get ahead of what it sees as a coming semiconductor bottleneck for AI growth.
On the compute side, SpaceX ended the second quarter with 1.4 gigawatts of AI compute and is targeting up to 10 gigawatts by the end of 2027.
Hyperscaler backlog, a proxy for AI demand across the industry, sat near $2.5 trillion at quarter end, roughly double from a year earlier, up from less than $500 billion in late 2022 before ChatGPT was released.
Second-quarter cloud revenue and data center capital spending both topped $100 billion for the first time, which is part of the backdrop feeding into every recent spcx news update and every fresh spcx price prediction from Wall Street desks.
Final Take On SpaceX Stock
SpaceX stock is caught between two stories right now. One is a strong AI compute growth story with real revenue upgrades behind it. The other is a share unlock and a delayed rocket launch that could bring short-term volatility.
A clean break and hold above $155 would support the bullish chart pattern. Losing the $144 support zone would weaken it.
Either way, SPCX stock is likely to stay volatile into the September 24 unlock and the September 28 Starship flight.
Disclaimer
This article is for informational purposes only and does not constitute financial advice. Stock prices, especially for newly listed and volatile companies, can move sharply in either direction. Price levels and targets mentioned here are technical observations based on chart patterns and are not guarantees of future performance. Always do your own research and consult a licensed financial advisor before making investment decisions.




















