Pi Price Prediction 2026: What Could Drive PI Next?


This PI price prediction looks at Pi Network's $PI token, which traded near $0.0917 as of September 27, 2026, 14:05 UTC, on MEXC, inside an ascending channel tracked since July. Support has held near $0.0852 twice this quarter. Resistance near $0.1120 hasn't broken yet, not once. Anyone comparing today's setup against past cycles can check the full price prediction archive.
Quick Prediction Box
Metric | Current Assessment |
$PI Price | $0.0917 (Sept 27, 2026, 14:05 UTC) |
Trend | Neutral, tilting bearish |
Immediate Target | $0.1120 |
Support | $0.0852 |
Resistance | $0.1120 |
RSI | 52.32 (neutral zone) |
Bull Case | Break above $0.1120 on rising volume, path toward $0.1600 |
Base Case | Range-bound between $0.0852 and $0.1120 |
Bear Case | Breakdown under $0.0852, retest near $0.0705 |
Invalidation | Daily close below $0.0700 |
Pi Network Price Prediction: What Is Happening Now
$PI last changed hands around $0.0917, up roughly 0.45% across the past day, per CoinMarketCap data. Market cap sat near $1.03 billion against a fully diluted valuation of $9.17 billion. Circulating supply stood at 11.24 billion PI, a small slice of the 100 billion max supply.
Volume over 24 hours came to $6.88 million, down about 32%. That drop matters. Thin volume near a range boundary rarely ends in a clean breakout.
$PI trades roughly 97% below its all-time high of $2.98 (Feb 26, 2025) and about 30% above its all-time low of $0.07072 (Jul 14, 2026).
$PI Technical Analysis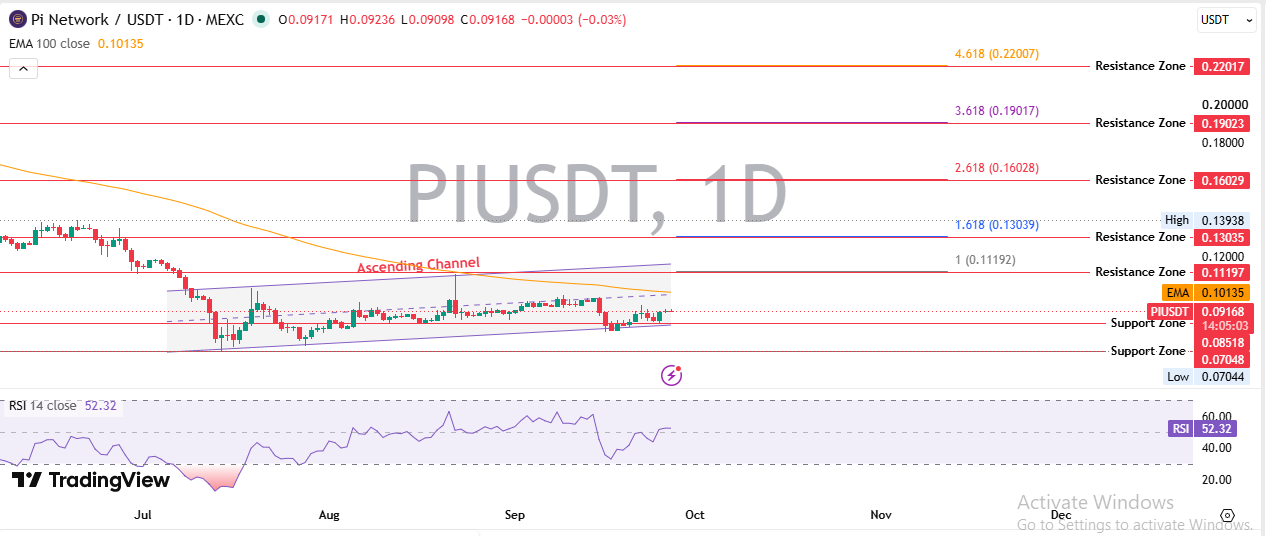
$PI Short-Term Trend
$PI grinds inside its ascending channel, formed since July, and the slope is flattening. The 100-day EMA sits at $0.10135, above the spot, keeping bias cautious. RSI at 52.32 sits in the middle, waiting.
Here's the thing: momentum is quietly rolling over. MACD reads -0.00056, below the signal at -0.00085, though the histogram turned slightly positive at +0.00029. More on whether this structure favors buyers or sellers sits in the recovery or trap breakdown.
Support and Resistance
Support sits at $0.0852 and $0.0705.
Resistance holds at $0.1120, then $0.1304, $0.1603, $0.1902, and $0.2202, based on Fibonacci extension zones tied to the recent swing.
RSI
The 14-period RSI reads 52.32. Neutral. Neither buyers nor sellers control this trade right now.
Moving Averages
The 100-day EMA sits at $0.10135, above spot, keeping trend bias soft until price reclaims that average.
MACD
MACD at -0.00056 versus signal at -0.00085 shows a mild bearish cross, though the histogram ticking up to +0.00029 hints at fading downside momentum.
Volume Analysis
Trading volume fell to $6.88 million, a 32% drop. Thin volume near range extremes usually signals indecision, not conviction.
Trend Structure
The ascending channel formed from July through September is flattening. That often precedes a breakdown, though fresh volume could resolve it upward instead. So does this signal exhaustion or just a pause before the next leg?
Breakout and Breakdown Levels
A daily close above $0.1120 confirms a breakout. A daily close below $0.0852 confirms a breakdown, opening the door toward $0.0705.
Key $PI Levels to Watch
Level Type | Price |
Support 1 | $0.0852 |
Support 2 | $0.0705 |
Resistance 1 | $0.1120 |
Resistance 2 | $0.1304 |
Breakout Confirmation | Daily close above $0.1120 with rising volume |
Invalidation | Daily close below $0.0700 |
$PI Price Prediction for October 2026
October brings a hard deadline. Node operators must finish upgrading to Protocol 28 by October 13, 2026 (UTC), ahead of the network-wide rollout on October 16, 2026 (UTC). Coverage of the earlier rollout sits in the prior protocol upgrade recap.
Trading should stay boxed between $0.0850 and $0.1200 unless volume returns.
Bull: a breakout above $0.1120 toward $0.1300.
Base: the same range held since August.
Bear: The channel breaks down, retesting $0.0850 then $0.0705. Invalidation sits below $0.0700.
$PI Network Price Prediction 2026
Scenario | Target Range | Main Trigger | Invalidation |
Bear | $0.045-$0.070 | Channel breakdown, KYC delays | Break above $0.13 |
Base | $0.085-$0.130 | Range recovery, steady upgrades | Move outside $0.07-$0.16 |
Bull | $0.160-$0.220 | Breakout with volume, exchange inflows | Fall below $0.085 |
Pi Price Prediction 2027
Bull
Real usage, not just speculation, drives this case. Developer activity plus more liquid exchange pairs could push $PI into $0.30-$0.50.
Base
Base case keeps $PI inside $0.12-$0.25, a slow grind as locked mining rewards unlock in stages. Nothing dramatic. Just gradual supply absorption.
Bear
If unlocks outpace demand, $PI could slip toward $0.05-$0.08. That's not a call anyone wants to make. But it's the math if selling pressure wins.
Pi Network Price Prediction 2028
PI's story by 2028 depends less on charts and more on whether Pioneers use the network for payments.
Base: $0.15-$0.35 on moderate adoption.
Bull: $0.40-$0.70 with real exchange depth.
Bear: under $0.10 if usage never converts to activity.
Assuming circulating supply near 22 billion PI by 2028, as further mining rewards unlock, base case implies a market cap near $3.3-$7.7 billion, bull case near $8.8-$15.4 billion, and bear case under $2.2 billion.
Pi Network Price Prediction 2029
Three years out, forecasting gets fuzzy.
Base: $0.20-$0.45.
Bull: $0.80-$1.20 if Pi becomes a genuine payments layer.
Bear: under $0.12 if liquidity never deepens.
With circulating supply assumed near 40 billion PI by 2029, the base case implies a market cap near $8-$18 billion, the bull case near $32-$48 billion, and bear case under $4.8 billion.
Pi Network Price Prediction 2030
This can't just stretch today's percentage move across four years. It has to account for adoption, supply growth, ecosystem depth, utility, liquidity, and where broader crypto sits by then.
By 2030, most of Pi's $100 billion max supply could be circulating. More supply against flat demand pushes price down. Utility is the swing factor. If not, $PI risks the fate seen across broader memecoin market coverage: high circulation, low price, and fading interest.
Bull case lands near $1.00-$2.00 with full utility and heavy liquidity.
Base case sits near $0.30-$0.60.
Bear case stays under $0.15 if adoption stalls.
Assuming circulating supply near 85 billion PI by 2030, close to the $100 billion max, bull case implies a market cap near $85-$170 billion, the base case near $25.5-$51 billion, and bear case under $12.75 billion.
What Could Drive Pi Network Price?
Pi Ecosystem Growth
Adoption inside Pi's app layer remains the biggest wildcard. The social mining model that built Pi's user base still shapes demand today.
Token Supply and Unlocks
Migrated mining rewards reached over 11.24 billion PI, with roughly 6.13 billion still locked. Checking unlock timing against a coin events calendar helps frame that risk.
Exchange Liquidity and Listings
PI trades across OKX, Gate, Bitget, MEXC, LBank, and more, with OKX carrying the deepest 24-hour volume near $2.21 million. Fresh exchange listings would thicken liquidity.
Network Upgrades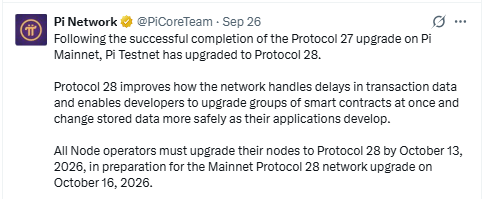
Protocol 28 testnet went live September 26. Node operators face an October 13 deadline. Mainnet adoption follows October 16, per the official protocol update.
Bitcoin and the Broader Crypto Market
Pi doesn't trade in isolation. Bitcoin's direction pulls altcoins along, and broader crypto market coverage frames whether risk appetite favors smaller-cap tokens.
Whale Activity
Large wallet moves can swing thin-volume tokens fast. With volume down 32%, one sizable order could push $PI through either boundary.
What Could Invalidate the $PI Forecast?
Technical invalidation arrives if PI closes below $0.0700, under the all-time low zone. Market invalidation follows a broad crypto downturn dragging every altcoin lower. Fundamental invalidation shows up if Protocol 28 stalls or introduces bugs. Supply-related invalidation happens if locked rewards unlock faster than expected. Genuine airdrop programs and unlock events deserve a spot on that watch list.
Disclaimer
This article is for informational purposes only and does not constitute financial, investment, or trading advice. Cryptocurrency markets are highly volatile, and prices can change fast. Readers should conduct independent research and consult a licensed financial advisor before making any investment decisions.

















