Pi Network Price Prediction: Is This PI's Real Recovery or a Trap?


Pi Network launched its open mainnet in February 2025, arriving after years of mobile mining through the Pi app and a community that grew into the tens of millions.
The project's pitch was always simple: mine crypto on a phone, no heavy hardware, no power bill.
That idea built a massive user base long before the coin ever traded freely, and it's a big part of why any Pi Network price prediction draws so much attention now.
And that history still shapes how traders read every Pi Network News headline today.
Pi Network price today is $0.09153, the Pi current price up 6.5% on the day.
Market cap sits around $1.029 billion, with the token still carrying one of the largest circulating supplies in the mid-cap tier.
Live PI Market Data
Metric | Value |
Price | $0.09153 |
24H Change | +6.5% |
24H Range | $0.08505 - $0.0923 |
Market Cap | $1.029B |
Source: market data taken from CoinGecko, as of Sep 26, 2026. Figures may vary slightly across other tracking websites.
Pi Network News Today
BSCN raised a question worth sitting with: whether a Pi Network recovery is actually underway.
The outlet's post, published around Sep 25, 2026, 11:56 UTC, pointed to data from CoinMarketCap showing the token up close to 6% over seven days.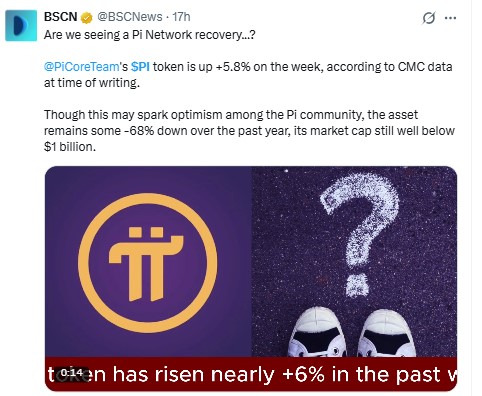
Source: Data Taken From @BSCNews, X Account, as of Sep 26, 2026
But the same post refused to sugarcoat the bigger picture. PI remains roughly 68% below where it stood a year ago.
Its market cap still sits well under one billion dollars by that outlet's framing, even with the weekly bounce. Two numbers, two very different stories.
Pi Coin Technical Analysis
This Pi Network technical analysis starts with the shape everyone keeps pointing at. On the 4-hour chart, PI is boxed inside a symmetrical triangle, a pattern where a falling trendline from above and a rising trendline from below squeeze price into a tightening range. 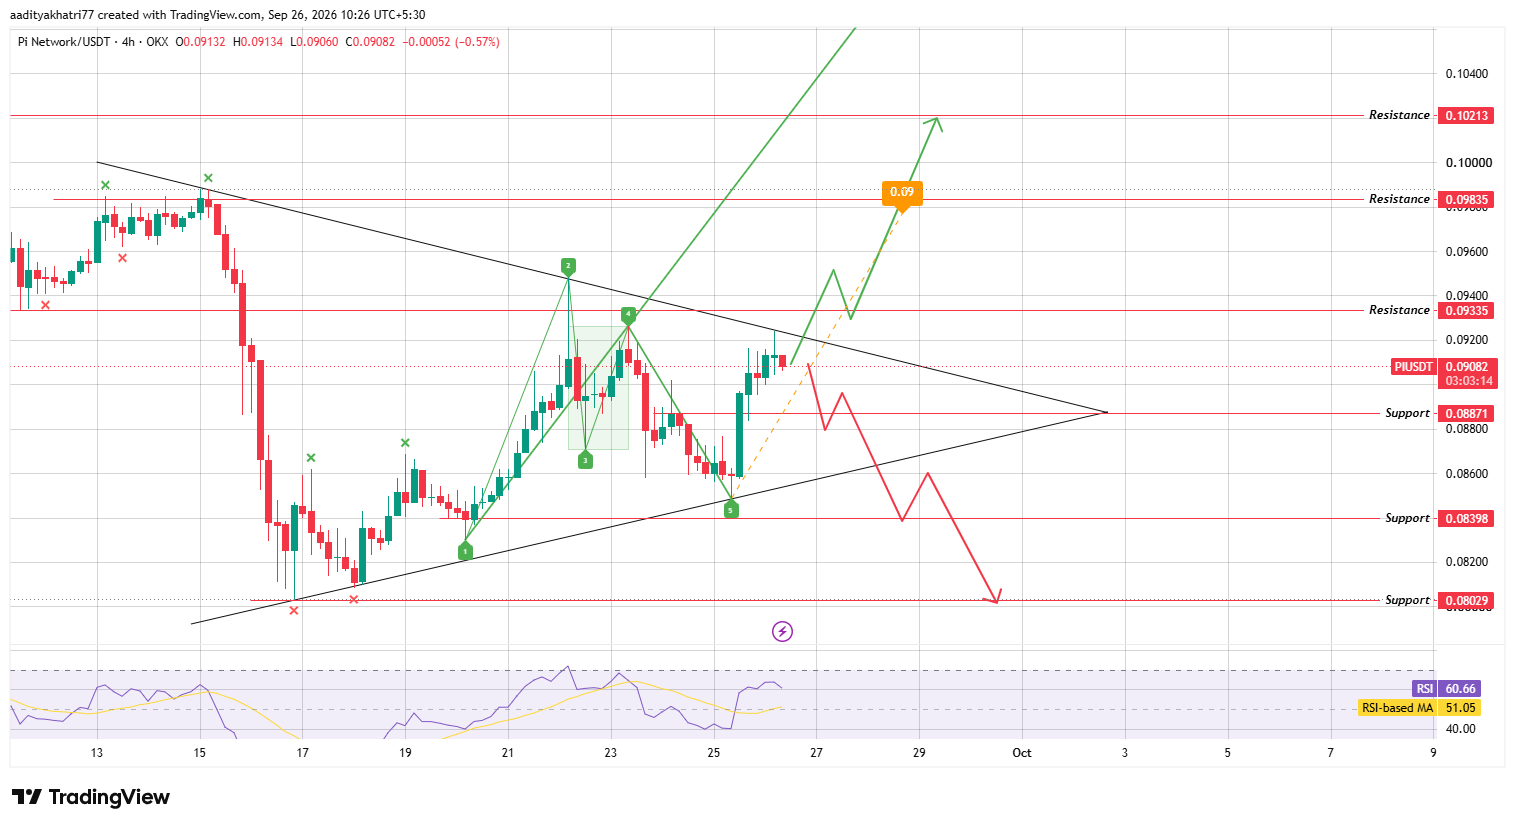
Source: Chart taken from TradingView, as of Sep 26, 2026
RSI reads 60.66, above its own moving average of 51.05.
That leans bullish. But a triangle this tight rarely stays quiet for long, and the apex is close, sitting right around the start of October.
Can PI Push Toward Higher Resistance?
A 4-hour trade above the falling trendline, backed by real volume, opens the door toward $0.09335 first. Clear that zone and $0.09835 comes into view next.
A Wolfe wave structure on the same chart marks five swing points and projects an extended move toward $0.10213 if buyers keep control.
That's the aggressive case. And it needs volume to confirm it, not just a wick through the line.
What Happens If PI Gets Rejected?
Rejection at resistance flips the setup fast. A break of the rising trendline and the $0.08871 support below it would send $PI hunting for $0.08398. Lose that too, and $0.08029 becomes the next real floor.
Breakdowns inside triangles tend to move quick once the support gives way. And this one has room to fall before the next real floor shows up.
Pi Network Price Levels
Support | Resistance |
$0.08871 | $0.09335 |
$0.08398 | $0.09835 |
$0.08029 | $0.10213 |
Bull, Base, and Bear Scenarios
Scenario | Setup | Level |
Bull | Trendline break with volume | $0.09335 to $0.10213 |
Base | Triangle holds, range trade | $0.08871 to $0.09335 |
Bear | Support and trendline break | $0.08398 to $0.08029 |
Pi Network vs Bitcoin
Bitcoin has spent recent sessions inside its own tightening range, and smaller tokens like $PI often take direction from how that larger market resolves.
A risk-on tape tends to help triangle breakouts hold. A risk-off shock tends to drag PI's support levels down with it, regardless of what the Wolfe wave target suggests.
Methodology
This Pi Network Price Prediction was built from a 4-hour PIUSDT chart sourced through TradingView, cross-checked candle by candle for the triangle boundaries and the Wolfe wave swing points.
Support and resistance levels came directly from the marked price zones on that chart.
Live price, market cap, and supply figures came from a separate market data snapshot taken the same day.
Nothing here substitutes for independent research; markets move fast, and a chart pattern only describes probability, not certainty.
Expert Opinion
Market commentary around PI Coin this week leaned cautiously optimistic.
Analysts tracking the weekly gain noted that a 6% bounce, while real, sits inside a year marked by an eighty-plus percent retracement from Pi Network's early mainnet highs.
Turns out, a short squeeze and a trend reversal are not the same thing, and traders watching the triangle apex near early October will treat volume, not price alone, as the real tell.
Disclaimer: This article is for informational purposes only and does not constitute financial advice. Cryptocurrency markets, including Pi Network, carry high volatility and downside risk; prices can move sharply against any projected level, and past performance offers no guarantee of future results. Readers should conduct independent research before making any investment decision.

















