A Meme Coin Price Prediction: Can AMC Hold Its Rally?


A 2-day-old token just did something most projects never manage in two years.
It grabbed a name every trader already knew and got the crypto timeline talking within hours.
Does this rally have legs, or is it about to run out of road?
This A Meme Coin price prediction breaks down what the trading data actually says, level by level.
A Meme Coin Price Prediction: Where Could AMC Go Next?
$AMC is trading near $0.1365 as of September 7, 2026, sharply higher than where it opened days earlier.
The trend leans bullish. Buyers have stayed in control since launch, and every dip has found takers fast.
The immediate target sits at the prior high near $0.1509. Clear that on volume, and the $0.20 zone opens up.
Key support holds around $0.12, the low from the recent hourly range. Lose that, and $0.10 becomes the next line traders defend.
Key resistance is the all-time high at $0.1509, set September 4, 2026.
Why is this moving? A public spat over a household brand name is pulling in eyeballs, and eyeballs are pulling in buyers.
AMC Live Data Snapshot (September 7, 2026,)
Metric | Value |
Price | $0.1365 |
24h change | +193.4% |
Market cap | $129.8M to $136.5M |
24h volume | $57.24M to $177.03M, source dependent |
Liquidity | $2.5M |
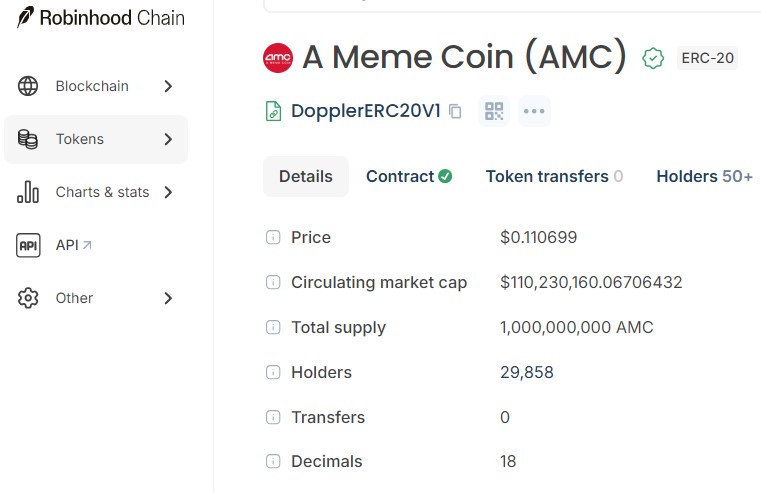
Holders | 29,858 to 29.9K |
RSI (14, 1h) | 72.96 |
MACD (12,26,1h) | 0.0182 vs. signal 0.0142 |
All time high | $0.1509, Sep 4, 2026 |
Supply | 1B circulating, 1B total, 1B max |
The spread across sources is normal for a token this new.
Why Is A Meme Coin Price Rising Today?
$AMC Volume and Liquidity Are Driving the Move
24-hour volume swings between $57M and $177M, depending on the tracker, dwarfing a token this young.
But liquidity sits at just $2.5M on GeckoTerminal's pool data. That gap matters. Thin liquidity fuels fast pumps, and fast drops too.
Is the Rally Supported by Real Buying Pressure?
Net buy flow reads positive, roughly $624,750 over 24 hours. So who is actually doing the buying here?
Sell transactions outnumber buys, 18,414 against 17,555, yet dollars in still win. Bigger wallets are stepping in.
What the Recent Price Action Says
On the hourly chart, $AMC opened at $0.1341, hit a high of $0.1394, dipped to $0.1209, then settled near $0.1375. That's a wide range for one hour.
We pulled up the volume bars next to it. The spike lines up with the breakout candle. Not a coincidence.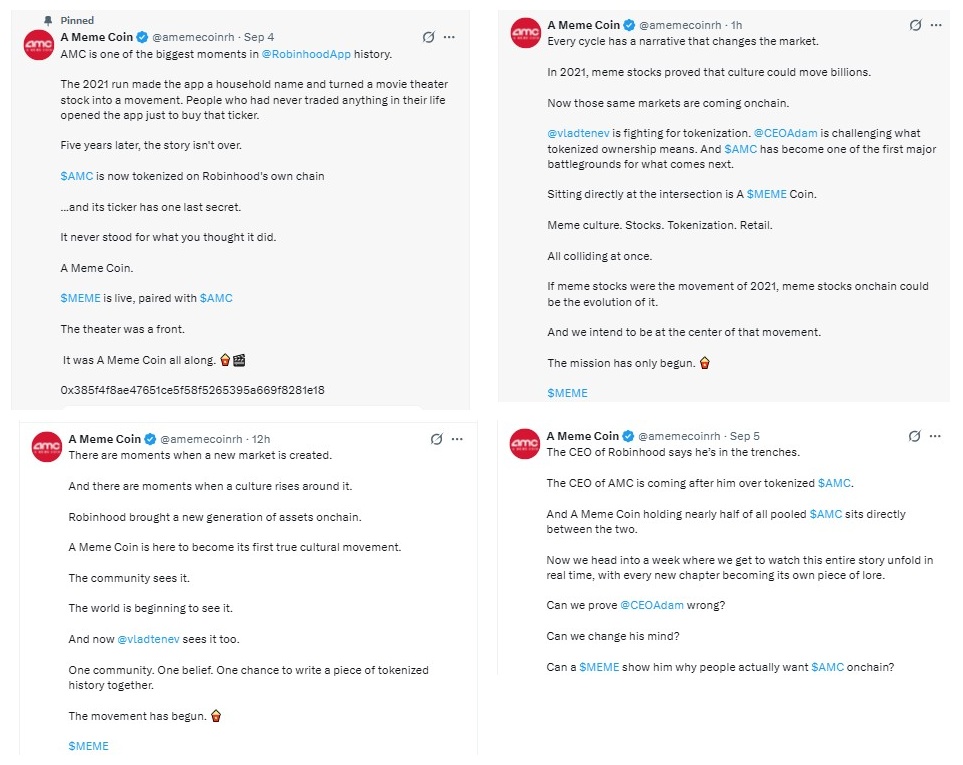
Recent posts from the project's own account, including this thread, lean into the branding story. Read more meme coin market news for similar cases.
AMC Technical Analysis and Key Price Levels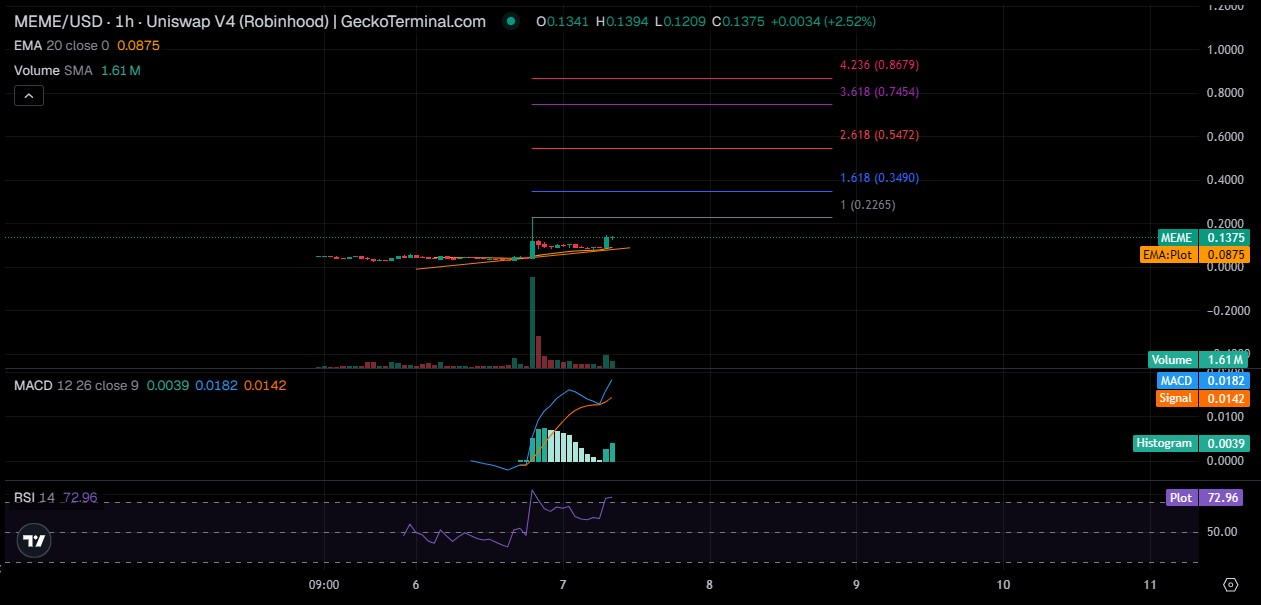
The 1h trading chart shows AMC breaking sharply above its EMA20 near $0.0875 on a real volume spike, with RSI at 72.96 and MACD at 0.0182 sitting above the signal line at 0.0142. The histogram stays positive at 0.0039. Fibonacci extensions from $0.2265 up to $0.8679 mark the levels traders are watching next.
AMC Support Levels to Watch
First support sits at $0.12, the recent hourly low.
Below that, $0.10 is psychological support.
And below that, the 20-period EMA near $0.0875 is the last realistic floor.
AMC Resistance Levels to Watch
The first wall is the all-time high at $0.1509.
Clear it on volume, and $0.2265 opens up next, the first Fibonacci extension.
Beyond that, $0.3490 needs a full second wave of buying.
RSI and Momentum Analysis
The 14-period RSI on the hourly chart reads 72.96. That's overbought.
Overbought doesn't mean an instant reversal, but fresh upside gets harder to earn from here. MACD backs that read, sitting above signal at 0.0182 versus 0.0142. Momentum still favors buyers, for now.
Volume and Breakout Confirmation
A break above $0.1509 only counts if volume rises to confirm it. Shrinking volume on a new high means treat it with suspicion. Fakeouts love a quiet breakout.
What Would Trigger a Breakdown?
A trading close back under $0.12 is the first warning sign. A drop under $0.10 on rising sell volume confirms the setup is done, for now.
AMC Price Prediction for the Next 7 Days
Bull case: a clear break above $0.1509 on strong volume, running toward $0.20.
Base case: a chop between $0.12 and $0.1509 while the market digests the recent run.
Bear case: support at $0.12 fails, sending $AMC toward $0.08 to $0.10.
Target range for the week: $0.10 to $0.20. Trigger: a trading close above $0.1509 on above-average volume. Invalidation: a daily close under $0.10.
A Meme Coin Price Prediction for 2026
Scenario | Target Range | What Must Happen |
Bull | $0.20 to $0.35 | Breakout above the all time high, sustained volume, fresh catalysts |
Base | $0.10 to $0.15 | Range bound consolidation, holder count grows slowly |
Bear | $0.03 to $0.08 | Support failure, liquidity thins out, and narrative fades. |
This A Meme Coin price prediction leans on one thing above any single indicator: whether the branding story keeps pulling in new eyes. Check the price prediction hub for how similar tokens have tracked.
Can AMC Reach $0.20, $0.50 or $1?
Target | Gain Needed | Implied Market Cap | Required Conditions |
$0.20 | About 46.5% | About $200M | Break the ATH, hold above $0.15, steady volume |
$0.50 | About 266% | About $500M | A fresh narrative wave, holders into six figures, deeper liquidity |
$1.00 | About 633% | About $1B | Would need to rival established large-cap tokens |
A one-dollar coin sounds exciting to say out loud. But with one billion tokens in total supply, that price means a billion-dollar market cap for a token barely a week old. Not impossible in crypto. Just very, very rare.
New listings tend to move these numbers fast. Track the exchange listing calendar for where AMC might land next.
AMC Price Prediction Risks Traders Should Watch
Extreme volatility, hourly swings into double digits
Low historical sample, only two days of trading data
Thin liquidity, $2.5M supporting a market cap over $130M
Profit taking, early holders sitting on triple-digit gains
Whale concentration, one community wallet reportedly holding nearly half of pooled AMC
One more thing worth flagging: statements from $AMC Entertainment's own leadership hint at a real dispute over the ticker and the brand.
Noted.
Market wide risk, a broad selloff hits the youngest tokens hardest
Bitcoin weakness, meme tokens usually fall faster than BTC
Data gaps between CoinGecko, GeckoTerminal, and the Robinhood chain explorer
New token uncertainty around ownership and locked liquidity
What Could Drive AMC Higher or Lower?
Bullish Catalysts
Escalation of the AMC Entertainment branding dispute could pull in fresh attention. A holder count near 29,900 shows retail interest hasn't slowed yet. And any spotlight from Robinhood's tokenization push tends to move the price fast. Check the coin events calendar for dates that could matter.
Bearish Catalysts
Legal pressure over ticker and brand use could force delistings or a rebrand. Thin liquidity means one large wallet exiting could crash the price within minutes. And once the news cycle moves on, momentum tokens like this tend to fade fast. Watch crypto airdrop activity too, since new distribution events can dilute a thin float.
Bitcoin and Broader Market Impact
Bitcoin sets the tone for risk appetite, and meme tokens feel it first. A steady or rising BTC gives AMC room to run. A falling BTC drags every high-beta token down with it, this one included.
AMC Trader Takeaway
Above $0.1509, the bullish continuation case stays alive, and $0.20 comes into view.
Between $0.10 and $0.1509, this is consolidation. Patience is the trade, not conviction either way.
Below $0.10, the bullish thesis is invalidated.
This chart looks ready to keep climbing. Actually, hold on, the RSI at 72.96 says the easy gains may already be behind it.
Watch volume more than price from here. Price without volume is just noise.
Disclaimer
This article is for informational purposes only and does not constitute financial advice. Cryptocurrency markets, especially newly launched tokens, carry extreme volatility and risk of total loss. AMC is a very new asset with thin liquidity and a limited trading history. Always do your own research and consult a qualified financial advisor before making investment decisions.

















