Allora Price Prediction: $ALLO Descending Channel, Bull Trap or Rally?


$ALLO just bounced off the lower boundary of its month-long descending channel, but with just 17 whale wallets controlling 96.52% of the market cap, this bounce looks fragile by design.
Allora is a decentralized AI network that lets independent workers contribute machine learning predictions and inferences on-chain, according to its own project materials.
This Allora Price Prediction breaks down whether this is a genuine reversal or a bull trap over the next two to three weeks, a case that stays alive above $0.24989, while a confirmed break below that level would flip it back bearish.
Here's what the chart and holder data show.
Allora Price Prediction Today: Market Overview
Metric | Value |
Price | $0.26731 |
24h Change | +10% |
Market Cap | $53.3M |
Unlocked Market Cap | $81.37M |
Fully Diluted Valuation (FDV) | $265.82M |
24h Volume | $21.34M |
Vol/Mkt Cap (24h) | 39.53% |
Liq/Mkt Cap | 0.04% |
Total Supply | 785.49M ALLO |
Max Supply | 1B $ALLO |
Circulating Supply | 200.5M $ALLO |
Holders | 8.03K |
Source: Data from CoinMarketCap as of 3/08/2026. Figures may vary slightly across other tracking websites.
Allora crypto: ALLO Liquidation and Volume Data
Liquidations over the past 24 hours have hit $144.68K, split between $84.40K in long liquidations and $60.28K in short liquidations, per Coinglass futures data (kept separate from the CoinMarketCap spot volume above).
Shorts got hit harder in the shorter windows: $40.96K in 1 hour ($2.93K long / $38.03K short), $48.99K in 4 hours ($2.99K long / $45.99K short), and $94.76K in 12 hours ($35.74K long / $59.02K short). 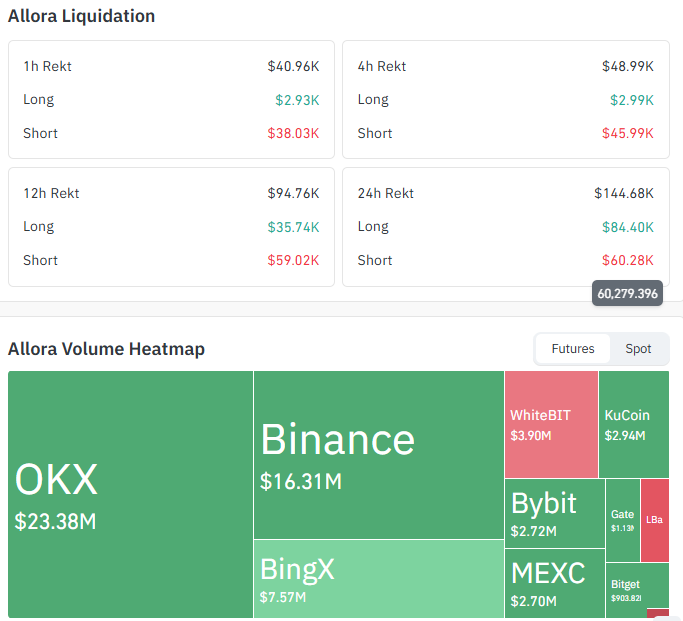
Source: Data From CoinGlass
This lopsided short liquidation pattern in the near-term windows lines up with ALLO's bounce-off channel support.
Exchange | 24h Futures Volume |
OKX | $23.38M |
Binance | $16.31M |
BingX | $7.57M |
WhiteBIT | $3.90M |
KuCoin | $2.94M |
Bybit | $2.72M |
MEXC | $2.70M |
Gate | $1.13M |
Bitget | $903.82K |
Allora Holder Concentration: A Key Risk Factor
ALLO's holder distribution is heavily skewed toward a small number of wallets. Just 17 whale addresses, only 1.40% of all holders, control 96.52% of the market cap, and the top 100 addresses combined hold 99.76% of the total supply. 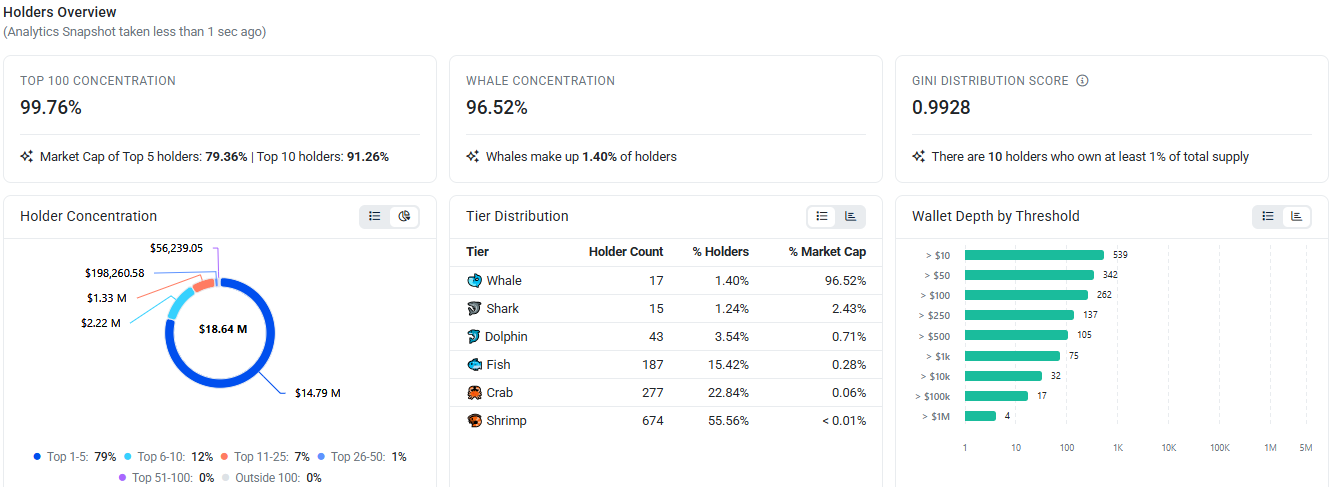
The Gini Distribution Score, a measure of inequality where scores closer to 1 indicate near-total concentration, sits at 0.9928.
By contrast, 674 "shrimp" wallets (55.56% of holders) collectively own under 0.01% of market cap.
This level of concentration means a single large wallet decision could meaningfully move price, and it's a factor worth weighing alongside the technical setup below.
ALLO Price Prediction Chart: Technical Analysis
Pair: ALLORA/USD · Market: Spot (Crypto) · Timeframe: 4H · Source: TradingView · Timestamp: August 3, 2026, 13:50 UTC+5:30
ALLO is trading at $0.26731, bouncing off the lower boundary of a descending channel that has been sloping down since late July, a structural feature kept distinct from the EMA readings below.
EMA (Exponential Moving Average, a momentum indicator weighting recent candles more heavily) 20 sits at $0.27065, and EMA 50 sits at $0.30612, both above current price and unreclaimed, acting as overhead resistance rather than support.
RSI (14), the Relative Strength Index, where readings above 70 signal overbought and below 30 oversold, sits at a neutral-to-bearish 41.74, still below the midline.
If the price breaks above the $0.28765 level and holds, along with an EMA crossover, it could signal a shift in trend. Until then, ALLO may see a short pullback and continue trading within the broader downtrend.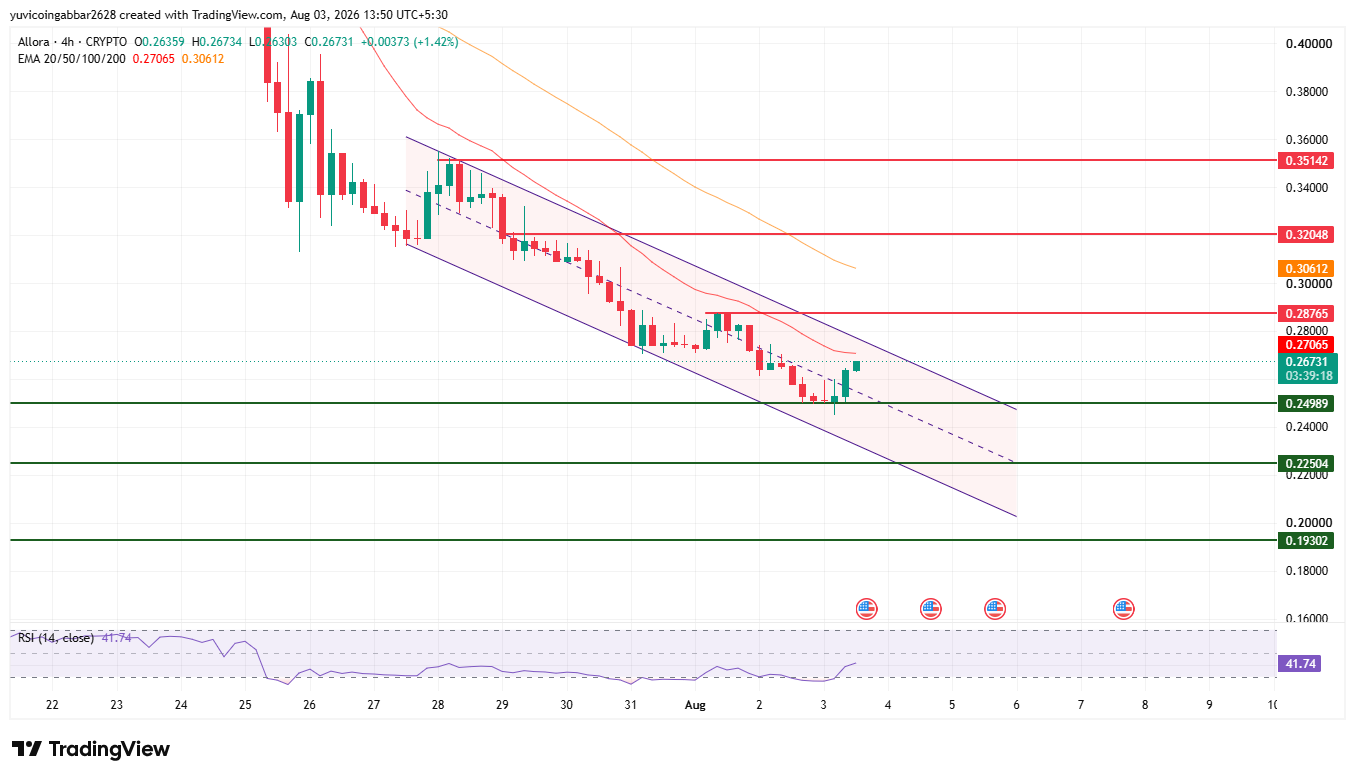
Level Type | Price |
Resistance 3 | $0.35142 |
Resistance 2 | $0.32048 |
Resistance 1 (nearest) | $0.28765 |
EMA 20 | $0.27065 |
Immediate Price Reference | $0.26731 |
EMA 50 | $0.30612 |
First Support | $0.24989 |
Deeper Support | $0.22504 |
Structural Floor | $0.19302 |
Allora Forecast: Bull Case vs. Bear Case
ALLO price target Bull case: Holding above $0.24989 and reclaiming EMA 20 at $0.27065 would be the first sign the channel breakdown is reversing.
A confirmed move above $0.28765 and out of the descending channel would open $0.32048, with $0.35142 as the next major test.
ALLO price target Bear case: A failure to hold $0.24989 would confirm this bounce as a bull trap within the ongoing downtrend, with $0.22504 as the next level to defend.
Losing that would expose the $0.19302 structural floor.
What Could Invalidate the Bullish Setup?
A rejection at EMA 20 ($0.27065) followed by a failure to hold $0.24989 would confirm this bounce was a bull trap rather than a reversal.
More significantly, a confirmed break below $0.22504 would put the $0.19302 structural floor at risk, especially given how thin liquidity could be if concentrated whale wallets decide to exit.
Allora Price Prediction Methodology
This forecast is built from multiple inputs rather than a single chart pattern: the descending channel structure, EMA positioning on the 4H chart, RSI momentum, the liquidation data showing short covering near channel support, and the holder concentration risk profile.
No single signal is treated as decisive on its own, and the measured-move target above is a conditional stretch scenario rather than a base-case expectation.
Allora Price Prediction 2026: Expert View
According to CoinGabbar analysts, the bounce-off channel support is real, and the near-term short liquidations back that up, but the holder concentration data adds a layer of caution the chart alone doesn't capture.
With 96.52% of market cap held by just 17 wallets, this remains a market where a handful of large holders could dictate direction regardless of what the technicals suggest.
RSI at 41.74 still sits below the midline, so the safer read is that ALLO needs to actually clear the channel and reclaim both EMAs before treating this as more than an oversold bounce.
Allora Price Prediction: Data Sources
Price, EMA, and RSI data referenced from a 4H ALLORA/USD chart via TradingView, timestamped August 3, 2026, 13:50 UTC+5:30. Liquidation and futures exchange volume data referenced from Coinglass.
Holder concentration and tier distribution data referenced from an on-chain analytics dashboard, snapshot taken August 3, 2026.
Market cap, FDV, spot volume, and supply data referenced from CoinMarketCap.
Disclaimer: This piece is for informational purposes only and isn't financial advice. Crypto prices are volatile, and it's worth doing independent research before acting on any of the levels discussed here.


















