SKYAI Price Prediction 2026: Can $SKYAI Bounce Back to $0.05?


A quiet AI-tagged token just posted a double-digit green candle, and the wallet data behind it tells a story most headlines will skip. $SKYAI trades near $0.032 right now, up roughly 9% in a day, and the bounce came right off a support shelf that's been tested more than once this month. Is this the start of something, or just another relief rally inside a bigger downtrend? This SKYAI price prediction walks through the daily setup, the weekly picture, and what more than 66,000 wallets are actually holding.
Table of Contents
Why SKYAI Is Moving Today
SKYAI Technical Analysis: Daily Chart
SKYAI Technical Analysis: Weekly Chart
SKYAI Support And Resistance Levels
SKYAI Price Prediction: Scenarios By Timeframe
SKYAI Tokenomics And Whale Concentration
Liquidations And Exchange Volume
SKYAI And The AI Altcoin Narrative
SKYAI Market Outlook: Risks To Watch
Key Takeaways
Key Takeaways
SKYAI trades near $0.0320, up over 9% in 24 hours per CoinMarketCap, still down more than 96% from its May 2026 all-time high.
Daily RSI sits near 38.35, still below the neutral 50 line, while weekly RSI reads 42.30. Neither chart is overbought.
The top 100 wallets hold 71.62% of tracked supply, and one exchange wallet alone controls over 36%. That's the number worth watching.
Invalidation for the bullish case sits under $0.02273 on the daily chart.
Why SKYAI Bounced After Weeks Of Grinding Lower
This SKYAI price prediction matters today because the token just added roughly 9% in twenty-four hours, per CoinMarketCap, pushing the price back up to $0.0320 after touching a 24-hour low near $0.02723. The daily chart had been carving out a descending channel since early July, and today's candle pushed price toward the upper edge of that channel on real volume.
Volume backed the move. 24-hour volume jumped over 184% to $17.37 million against a $32 million market cap, a vol-to-cap ratio near 49.8%, and that kind of spike rarely happens on thin interest alone.
Turns out, a token that's fully diluted already, meaning circulating supply already matches total supply, tends to react harder to fresh volume than one still facing unlock pressure. Anyone comparing this move against other AI-tagged tokens might find it useful to check the AI rally coverage on $SKYAI from earlier this cycle.
SKYAI Technical Analysis: Daily Chart
On the daily TradingView chart, SKYAI opened near $0.02917 and trading near $0.03205, up 9.87% on the session, was trading inside a descending channel, breakout the upper band of the channel.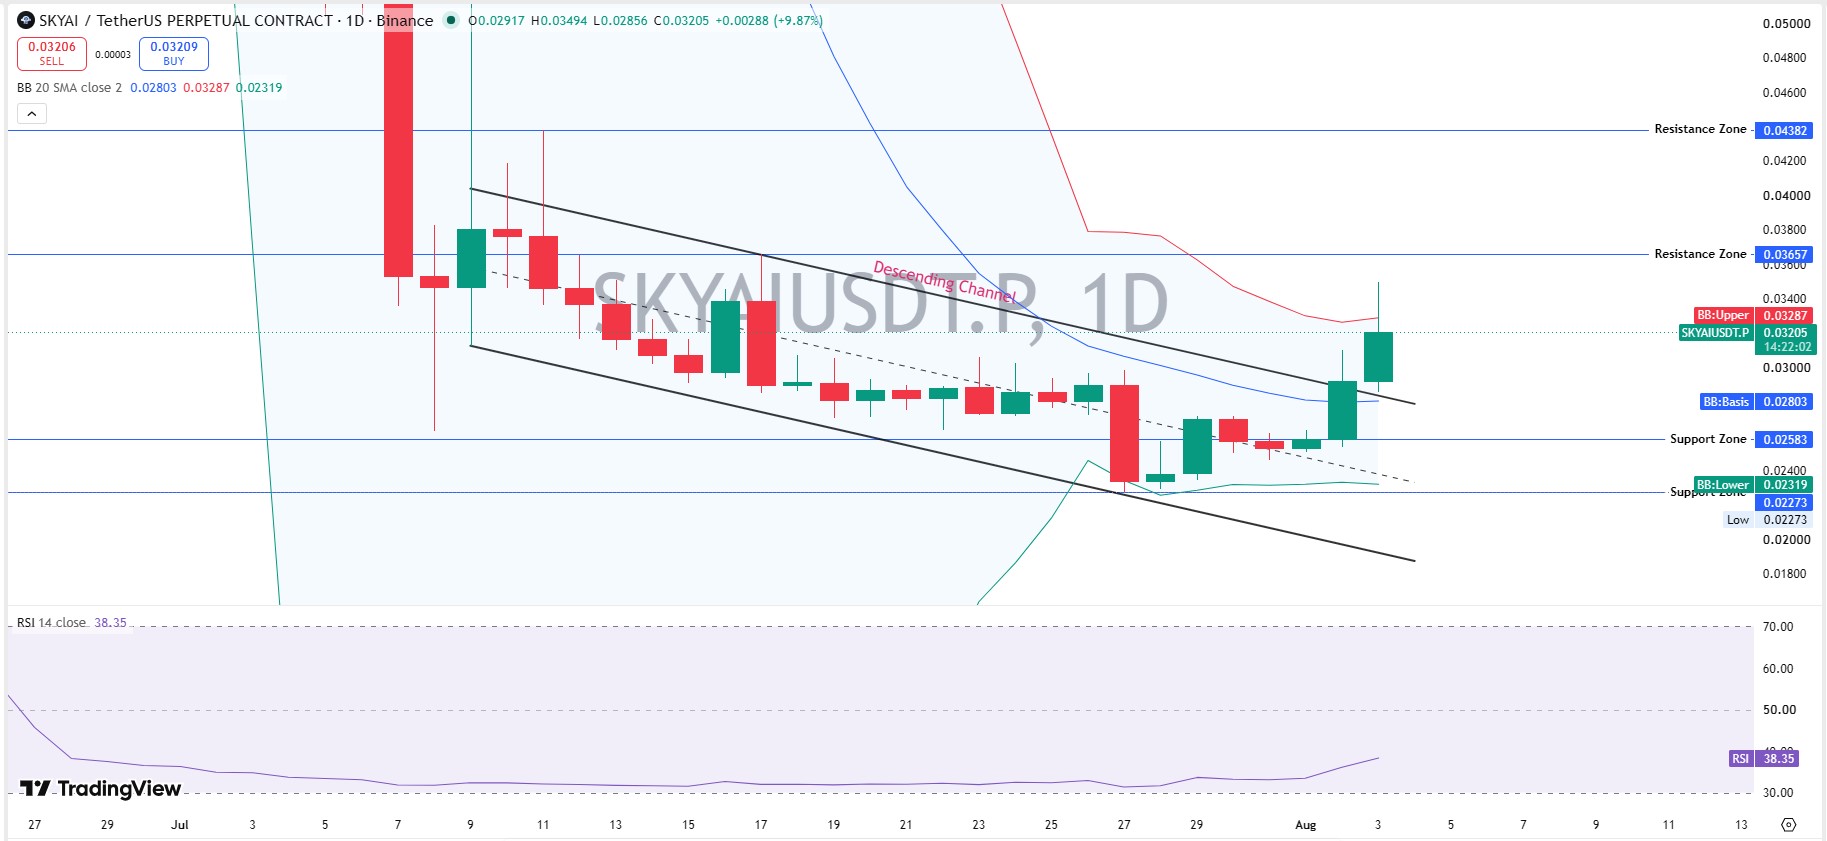
Resistance stacks first at $0.03657, then $0.04382. Support runs at $0.02583, backed by a deeper floor near $0.02273, which lines up with the lower Bollinger Band.
Daily RSI reads 38.35. That's not overbought. When we pulled up the chart, what stood out wasn't the candle itself but how far RSI still has to climb before this even looks stretched.
A daily close above $0.03657 would put real pressure on the descending channel. Losing $0.02583 fast would flip that read entirely.
Full daily-chart context on this exact setup sits in the bulls catch a falling knife breakdown from earlier coverage.
SKYAI Technical Analysis: Weekly Chart
Zoom out and the weekly chart shows a token still deep inside a descending channel. $SKYAI opened near $0.02917 and trading near $0.03209, up just over 10% for the week, with Bollinger Bands still absurdly wide from the collapse off the May all-time high.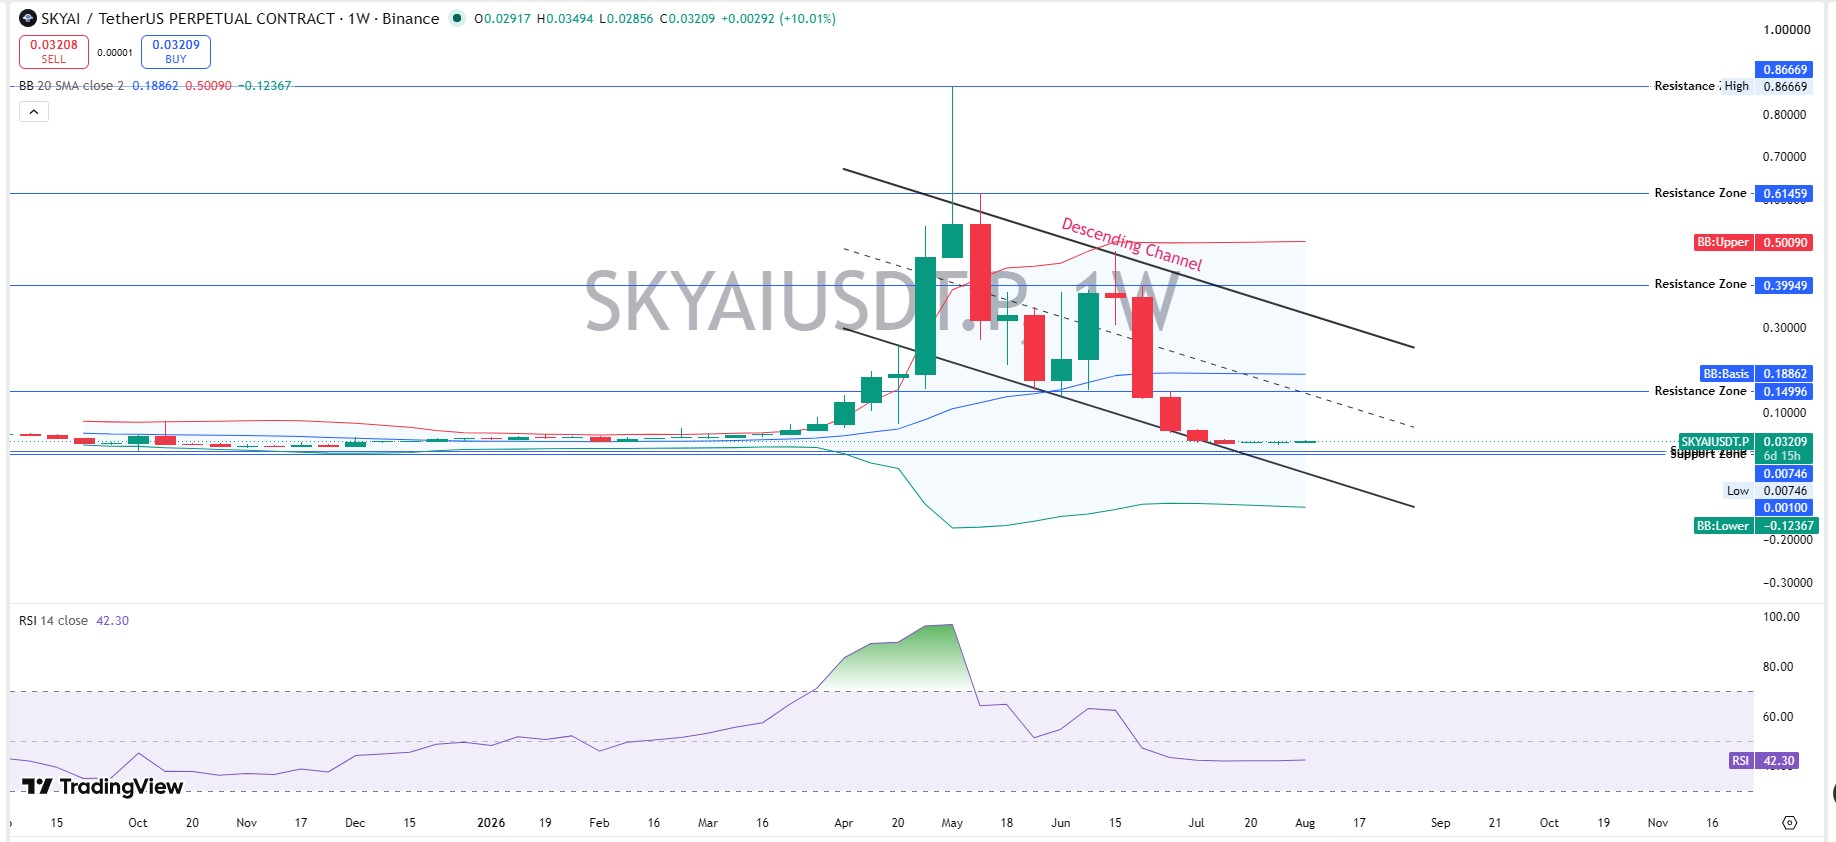
Weekly resistance sits far overhead at $0.39949, then $0.61459, then the old high near $0.86669. None of those are realistic near-term targets. Support holds right around the current $0.02583 zone, where price has been coiling for weeks.
Weekly RSI reads 42.30, climbing but still under neutral. Here's the thing: a weekly RSI recovering from the low 30s toward 50 usually means selling pressure is fading, not that a new uptrend has confirmed itself yet.
A weekly close back above $0.10 would be the first level that actually changes the long-term structure.
SKYAI Support And Resistance Levels
Immediate support: $0.02583, then $0.02273.
Immediate resistance: $0.03657, then $0.04382.
A daily close above $0.03657 would confirm the channel is breaking, and would strengthen this $SKYAI price prediction for a run toward the next zone.
SKYAI Price Prediction: Scenarios By Timeframe
Timeframe | Bull Case | Base Case | Bear Case |
24H | Holds above $0.031, tests $0.0366 (moderate) | Chops between $0.028-$0.034 (high) | Slips under $0.0258 (low) |
7D | A daily close above $0.0438 opens $0.05 (low-moderate) | Range-bound under channel resistance (high) | A close under $0.0227 confirms fade (moderate) |
Aug 2026 | Channel breaks and targets $0.05-$0.10 (low) | Drifts $0.025-$0.045 tracking AI-token flows (moderate) | Retests the $0.0143 all-time low zone (low-moderate) |
Invalidation for the bullish SKYAI price prediction is a daily close under $0.02273.
SKYAI Tokenomics And Whale Concentration
Total and max supply both sit at 1,000,000,000 SKYAI, and circulating supply already matches that figure, so there's no future unlock overhang to price in. Market cap runs near $32 million, matching FDV exactly since nothing is left to vest, per CoinMarketCap. Liquidity-to-market-cap reads a healthier 13.06%.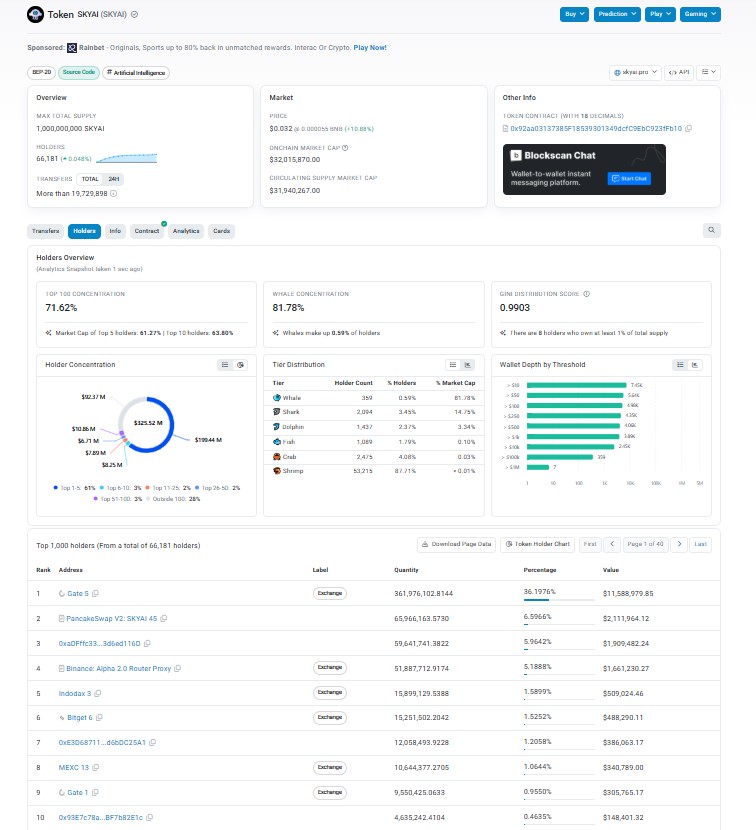
Holder count sits at 66,181 wallets, with more than 19.7 million transfers recorded to date. Concentration, though, still runs heavy. Top 100 wallets hold 71.62% of tracked supply, with the top 5 alone controlling 61.27% and the top 10 at 63.80%.
Whale concentration reads 81.78%, and the Gini distribution score sits at 0.9903, with eight wallets each holding at least 1% of total supply.
Tier | Holder Count | % Holders | % Market Cap |
Whale | 359 | 0.59% | 81.45% |
Shark | 2,094 | 3.45% | 14.73% |
Dolphin | 1,437 | 2.37% | 3.34% |
Fish | 1,089 | 1.79% | 0.10% |
Crab | 2,475 | 4.08% | 0.03% |
Shrimp | 53,215 | 87.71% | 0.01% |
This concentration profile reads differently than SKYAI's earlier rotation phase, covered in the altcoin rotation breakdown, where volume came from a wider set of wallets.
The single largest wallet is labeled Gate 5, an exchange address, holding 36.1976% of the supply worth roughly $11.59 million. The number two spot belongs to a PancakeSwap V2 liquidity pool at 6.5966%, which isn't a seller risk in the same way a personal wallet is. Spot three is an unlabeled wallet at 5.9642%, worth about $1.91 million, and that's the one worth actually watching.
Fourth place goes to the Binance Alpha 2.0 Router Proxy at 5.1888%, another exchange-linked address.
Wallet data and CertiK's 4.0-star rating for this contract are trackable directly on BscScan.
Liquidations And Exchange Volume
Per CoinGlass liquidation data, 24-hour liquidations hit $69.13K, split between $47.08K in longs and $22.05K in shorts. Longs took the bigger hit this time.
Binance carries by far the heaviest volume at $37.37 million, with BingX a distant second near $7.15 million and Bitget close behind at $5.36 million. MEXC, Gate, Bitunix, and KuCoin each hold smaller slices of the total.
Fine. That's real derivative interest stacking up on a $32 million market cap token, and it's worth stacking against a large-cap comparison, like the coverage on the Bitcoin 2026 outlook page.
SKYAI And The AI Altcoin Narrative
SKYAI sits inside the artificial intelligence token category, and that narrative has pulled real capital toward AI-tagged altcoins whenever broader risk appetite improves. It's not a meme chart riding a joke. It's positioned around AI infrastructure and agent-related themes that keep showing up across the sector.
And a 9% daily move on a token already down over 96% from its all-time high doesn't automatically mean the trend has turned. But rising volume alongside an RSI recovery from oversold levels is exactly the setup traders watch for early signs of a base forming.
This is why the SKYAI price prediction 2026 keyword keeps showing up alongside broader $SKYAI crypto price prediction searches. Related coverage on the MCP hub surge analysis digs into the AI-agent side of this story in more depth.
SKYAI Market Outlook: Risks To Watch
Whale wallets top the risk list here, even with concentration lower than plenty of comparable low-cap tokens. A single unlabeled wallet near 6% of supply can still move price without warning.
A break below $0.02273 would put SKYAI back on track toward its all-time low near $0.0143, set on October 11, 2025. That's a real scenario, not scare talk.
Macro matters too. A softer Fed rate path tends to lift risk appetite across small-cap altcoins broadly, and $SKYAI would likely move with that tide. Coverage of the Fed rate decision tracks that catalyst as it develops.
Staying on top of headline risk matters as much as the chart does. The latest crypto news tends to flag catalysts before they hit price.
It's also worth checking a coin events calendar for anything scheduled around $SKYAI this month.
Reward campaigns can move volume fast too, so crypto airdrop trackers are worth a glance before assuming this bounce stands alone.
Anyone comparing SKYAI against other 2026 setups can browse the full price prediction hub for context on how this bounce stacks up against the rest of the market.
Methodology
Chart levels came from SKYAI/USDT daily and weekly perpetual charts on Binance via TradingView, using RSI-14 and 20-period Bollinger Bands, captured on August 3, 2026, around 14:22 UTC. Price, supply, and market-cap data came from CoinMarketCap, also captured on August 3, 2026, around 14:22 UTC. Holder and Gini concentration data came from on-chain wallet tracking for contract 0x92aa03137385F18539301349dcfC9EbC923fFb10 on BNB Chain. Liquidation and volume figures came from CoinGlass.
Disclaimer
This is speculative market commentary, not financial or investment advice. Crypto assets are volatile and can lose most or all of their value. Verify live figures before trading.


















