Aptos Price Prediction: Can APT Escape Seller Pressure Again?


APT Tried To Break Free. Sellers Had Other Plans.
Aptos price prediction discussions are heating up again as APT pulls back from its latest attempt to climb out of a multi-month downtrend.
The token tested the upper edge of its long-standing descending channel, only to get pushed back down within hours.
APT now trades near $0.5756, close enough to support that every candle over the next day or two could decide which way this chart leans next.
Why Is Aptos Price Down Today?
Aptos is down about 1.7 percent over the past 24 hours, with volume also slipping around 8 percent to $22.07 million.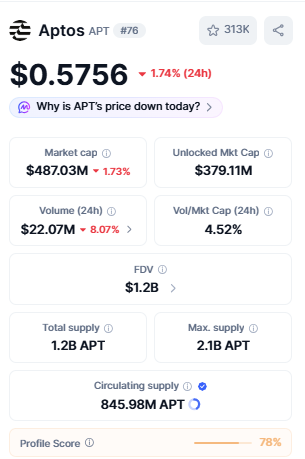
Market cap sits near $487 million. None of this is dramatic on its own, but it matters because it comes right after buyers tried and failed to push through resistance near the top of the channel.
That failed attempt is really what set today's mood.
Data source: CoinMarketCap
Ecosystem Momentum Is Building, But Price Has Not Followed
Aptos recently pointed to ongoing coverage of its network development, highlighting more than 50 million dollars committed toward markets and machines, along with tokenomics changes designed to reward real usage rather than pure speculation.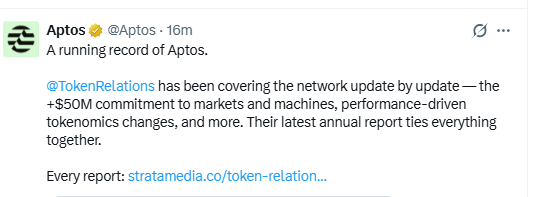
It is the kind of update that usually earns a project attention, and it does add a constructive backdrop for anyone weighing an Aptos price prediction over the medium term.
What it has not done, at least so far, is change the shape of the daily chart. Price action and ecosystem headlines are simply moving on different clocks right now.
Traders Are Long. The Chart Is Not Convinced.
Derivatives data shows a clear tilt toward longs across most venues. The Binance APT/USDT long short ratio sits at 1.31, top trader accounts are even more lopsided at 1.84, and top trader positions show longs outweighing shorts by nearly four to one.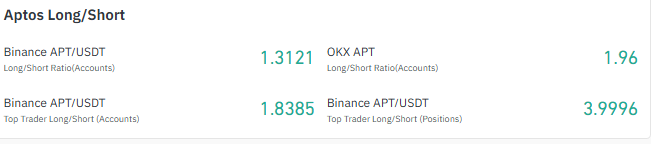
OKX accounts show a similar 1.96 lean toward longs.That kind of positioning usually means traders expect a bounce. The problem is the last 24 hours punished exactly that bet. 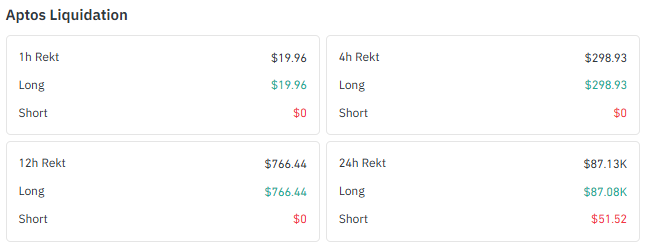
Liquidation data shows almost the entire $87.13K wiped out in that window came from long positions, with shorts barely touched.
The smaller liquidation windows tell the same story, every dollar liquidated across the past 1, 4, and 12 hours came from longs.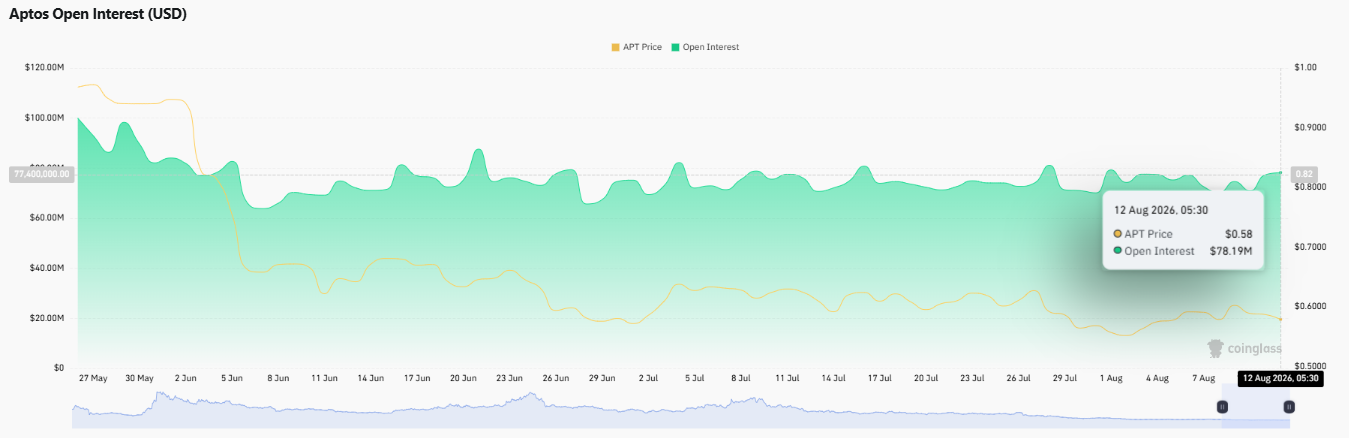
Open interest is still holding near $78 million even as price has slipped, which means leveraged traders have not given up on a recovery; they have just been early.
Data source: coinglass
The Daily Chart Still Says Downtrend
APT remains inside a descending channel on the TrdingView daily timeframe. The recent bounce carried price toward the upper boundary of that channel before sellers stepped back in, which is exactly the kind of rejection that keeps a downtrend intact.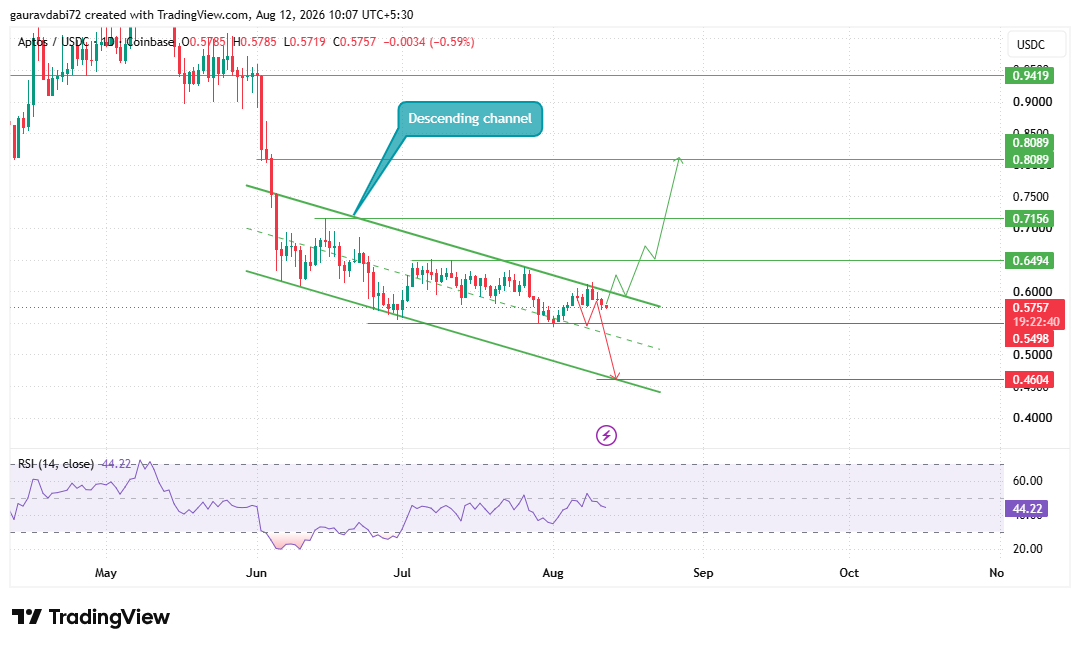
Momentum is not strongly bearish either. Daily RSI sits at 44.22, below the neutral 50 mark but nowhere near oversold territory, suggesting sellers have an edge without full control of the tape.
Data source: TradingView
Aptos Support and Resistance Levels To Watch
$0.5498 is the level that matters most right now. Price is trading close enough to it that a clean break could open the door toward $0.4604, the next area buyers would likely need to defend.
On the upside, the first real test for APT is simply closing above the descending channel itself.
A confirmed break could bring $0.6494 into view, and continued strength beyond that would put $0.7156 on the radar.
The higher Aptos resistance levels at $0.8089 and $0.9419 are further out and would need a much stronger shift in structure before they become realistic conversation points.
APT Price Prediction Scenarios
Scenario | What It Would Take |
Bull Case | A confirmed daily close above the descending channel opens room toward $0.6494, and continued buying pressure beyond that could bring $0.7156 into view. |
Neutral Case | APT holds between the $0.5498 support zone and the channel resistance overhead, chopping sideways without a clear breakout in either direction. |
Bear Case | A clean break below $0.5498 shifts attention toward $0.4604 as the next area where buyers may look to step back in. |
How APT Has Performed Across Timeframes
Zooming out, APT is actually flat to slightly higher over the past 4 hours, up about 0.10 percent, and down a modest 1.69 percent on the day.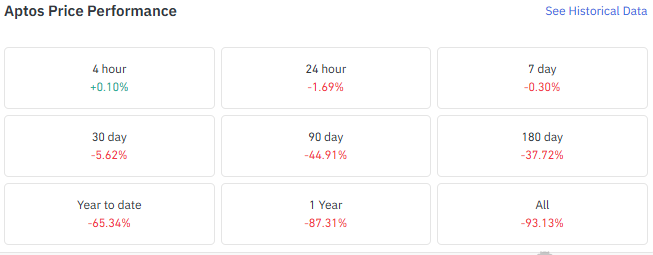
The 7-day change is barely negative at 0.30 percent, but the picture gets heavier further back; APT is down 5.62 percent over 30 days, 44.91 percent over 90 days, and 37.72 percent across 180 days.
Year to date the token has lost 65.34 percent, and it is down 87.31 percent over the past year, with an all-time decline of 93.13 percent from its peak.
The short-term stability stands in sharp contrast to the scale of the longer-term damage.
Data source: coinglass
What Analysts Are Watching Next
CoinGabba analysts covering Aptos note that a positive ecosystem update and long heavy derivatives positioning are not, by themselves, enough to change a daily downtrend.
The descending channel remains the dominant force in this chart, and until APT closes convincingly above it, rallies are likely to keep getting sold into.
The current setup looks more like a market waiting for confirmation than one already committed to a direction, and the response near support in the coming sessions is likely to say more than the news cycle has so far.
Disclaimer: This article is for informational purposes only and should not be treated as financial advice. Cryptocurrency markets are highly volatile, and prices can move sharply in either direction. Readers should conduct their own research and consult a qualified financial advisor before making any investment decisions.
Also read:

















