Audiera Price Prediction: BEAT Drops 15% Despite Big Burn


BEAT just had one of its roughest sessions in weeks, and the strange part is it landed on the same day Audiera put out some of its strongest fundamental news in months.
This Audiera price prediction looks at why a 15% drop and a clean burn report showed up together and what the 4-hour chart says comes next.
A question tied to the wider altcoin price prediction picture and the $BEAT technical analysis traders have been running on this channel for days.
A Rough Day for BEAT Holders
$BEAT is trading at $2.84, down 15.42% in 24 hours, dragging market cap down 15.47% to $939.18 million.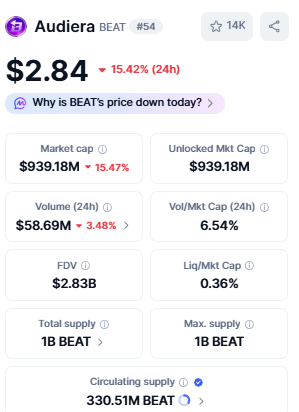
Volume slipped too, down 3.48% to $58.69 million, with the volume to market cap ratio sitting at 6.54%.
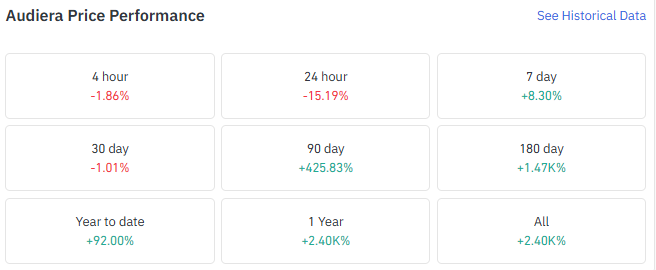
Zoom out, though, and the picture flips completely; $BEAT is still up 8.30% over the past week, 425.83% over 90 days, and roughly 2,400% over the past year.
So today’s drop barely dents a run that has made this one of the standout performers of the year.
Data source: coinglass/coinmarketcap
The Burn Kept Going, So Why Did Price Fall?
On August 3, Audiera posted its weekly revenue and burn update covering July 27 through August 3.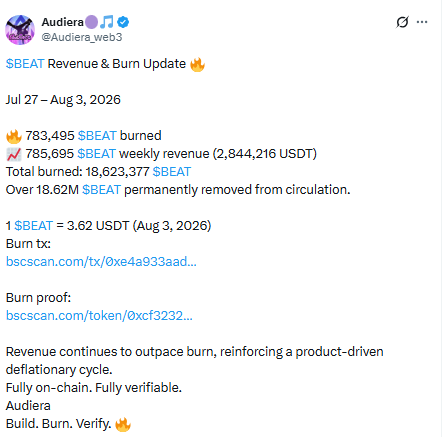
It showed 783,495 $BEAT burned against 785,695 $BEAT in weekly revenue, worth 2,844,216 USDT, pushing the total burned to 18,623,377 BEAT, over 18.62 million tokens permanently pulled out of circulation.
Revenue outpacing burn is exactly the kind of number that is supposed to reinforce a deflationary story, but it clearly wasn’t enough to hold sellers back today; the drop happened anyway, right on top of the update.
Longs Paid the Price for Today’s Drop
Liquidations over the last 24 hours hit $564.08K, and longs absorbed the bulk of it at $454.97K against just $109.11K from shorts, a sign that buyers were caught off guard as prices fell.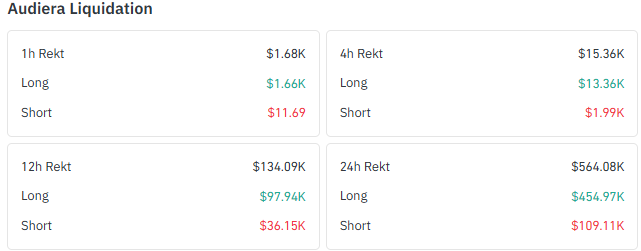
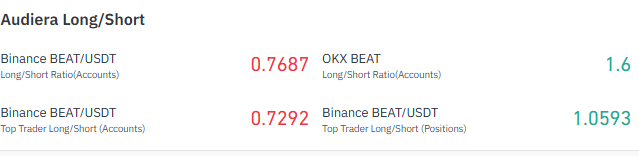
Positioning backs that up on Binance, where the BEAT/USDT ratio sits short-leaning at 0.7687 and top trader accounts are even more short at 0.7292, though OKX tells a different story at 1.6.
Open interest is $72.22 million. OKX leads futures volume at $185.21 million, more than double Binance’s $91.59 million, with MEXC and LBank both above $42 million.
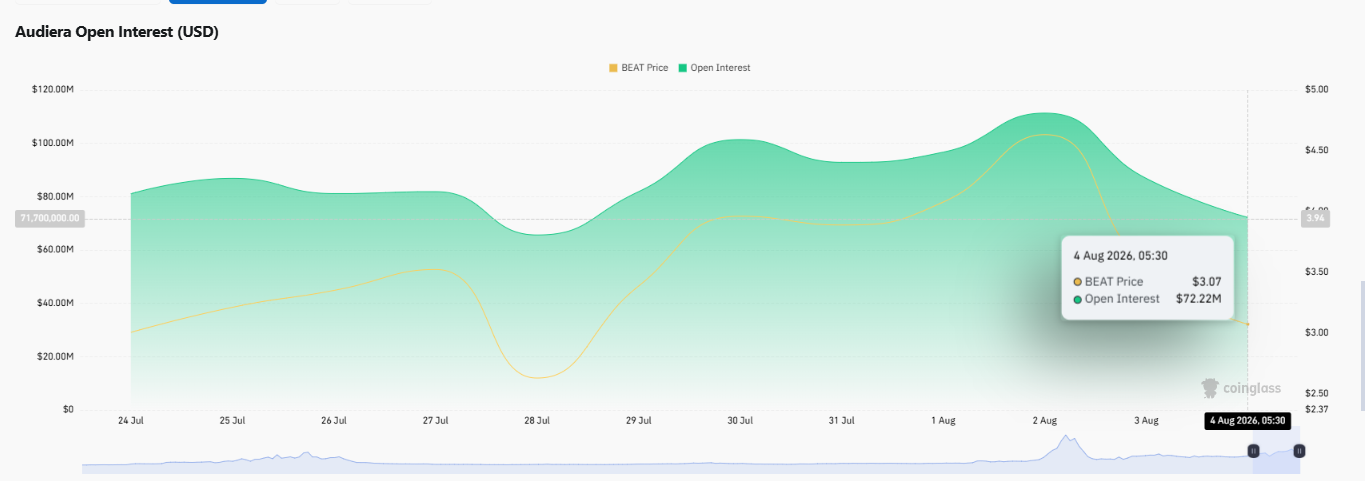
Data source: coinglass
The Chart Still Has Sellers in Control
$BEAT remained inside a descending channel on the 4-hour chart after giving a spike till $5.986 but did not sustain above the level and gave a pullback.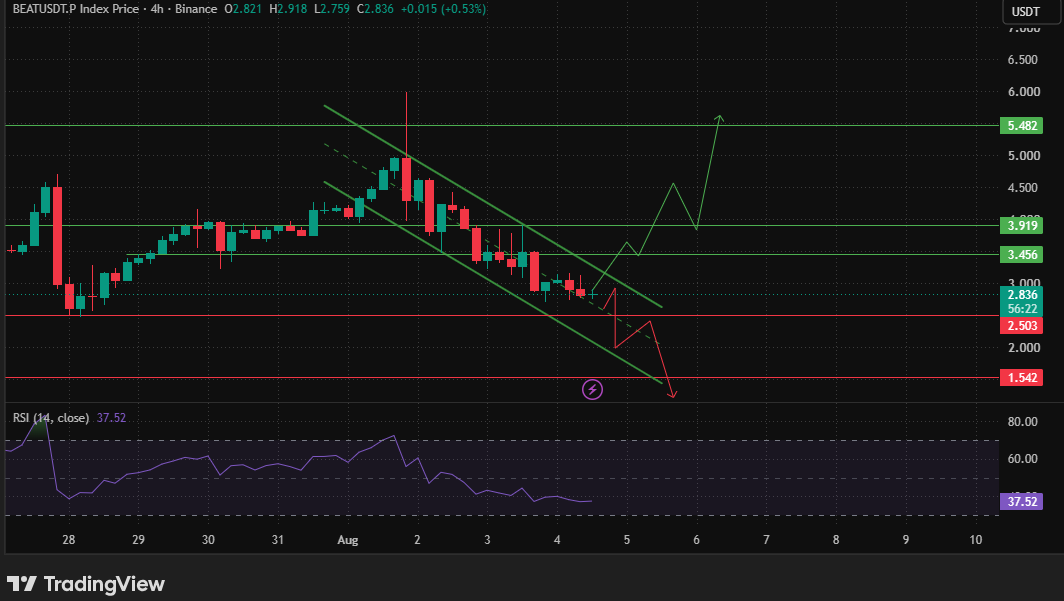
RSI reads 35.50, below neutral, and that keeps the short-term edge with sellers.
A close above the channel would shift the picture, with resistance first at $3.456, then $3.919, and $5.482 further out if that breakout holds
Without it, $2.503 is the level to watch, and losing that opens $1.542 as the next demand zone.
Where Does BEAT Go From Here?
Scenario | 4-Hour Chart |
Bullish | Closes above the channel and clears $3.456, then $3.919, with $5.482 as the larger target |
Base | Holds between $2.503 and $3.456 while RSI stays under 50 |
Bearish | Loses $2.503, opening a path toward $1.542 |
As per the Coingabbar analyst, $BEAT remains trapped inside its descending channel, and today’s drop, even against a clean burn report, shows sellers still have the final say in the short term.
RSI at 35.50 leaves room before hitting oversold, so a bounce inside the channel would not be surprising, but it takes a close above $3.456 to change the broader structure.
Until that happens, $2.503 is the level that decides whether this stays a sideways channel or turns into a deeper slide toward $1.542.
Disclaimer: This analysis is for informational purposes only and does not constitute financial advice. Cryptocurrency markets are volatile, and readers should conduct their own research before making investment decisions.


















