Cysic Price Prediction 2026: Can $CYS Hold Above $0.38?


A quiet zero-knowledge infrastructure token just posted one of its loudest days in months, and the move did not come from a random tweet. It came from a chart pattern that had been forming for weeks, breaking at exactly the moment volume showed up to confirm it. Is this the start of a real leg higher or a sharp bounce that fades once the excitement cools? This Cysic price prediction walks through the daily setup, the weekly structure, and the network numbers behind the move.
Table of Contents
Why CYS Is Moving Today
CYS Technical Analysis: Daily Chart
CYS Technical Analysis: Weekly Chart
CYS Support And Resistance Levels
Cysic Price Prediction: Scenarios By Timeframe
CYS Tokenomics And Network Activity
Liquidations And Exchange Volume
CYS And The Decentralized AI Altcoin Narrative
Market Outlook: Risks And Catalysts
Glossary
Key Takeaways
CYS trades near $0.3849, up 34.42% in 24 hours per CoinMarketCap, still down 45.87% from its March 23, 2026, all-time high.
Daily RSI sits at 69.42, approaching overbought. Weekly RSI reads a calmer 53.07.
The daily chart just cleared a descending channel. The weekly chart is resolving out of a symmetrical triangle.
Invalidation for the bullish case sits under $0.2761 on both timeframes.
Why CYS Is Moving Today
Here's the thing about this Cysic price prediction: the setup was building long before today's candle showed up.
$CYS opened near $0.2840 and printed a high of $0.5100 before settling around $0.3907, per the daily TradingView chart. That is a 37.52% daily swing, and it did not happen quietly.
Volume backed it up. Per CoinMarketCap, 24-hour volume jumped 1,055.98% to $35.32M, pushing the volume-to-market-cap ratio to 44.78%.
That's rare for an infrastructure token this size.
And the timing lines up with Cysic's own community calendar. The project just confirmed its next community AMA for August 6 at 12:30 PM UTC, where the team plans to discuss its Venus product and new decentralized AI work.
Anyone tracking upcoming catalysts should keep an eye on a coin events calendar before assuming this move stands alone.
CYS Technical Analysis: Daily Chart
On the daily MEXC chart, $CYS trades at $0.3907, up from an open of $0.2840, after clearing a multi-week descending channel.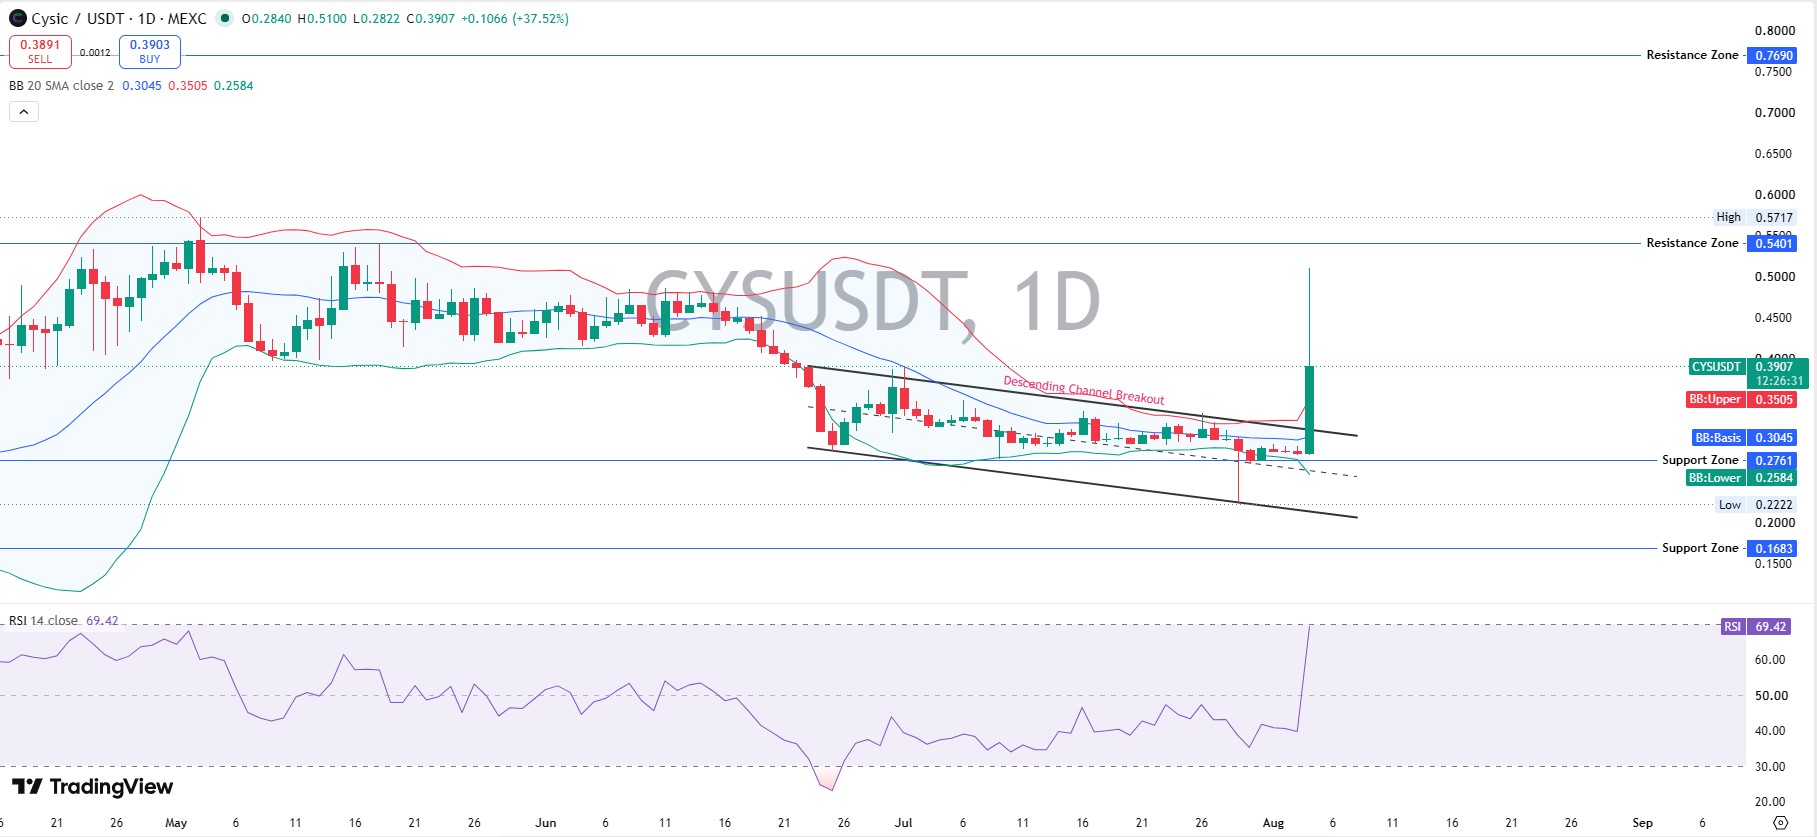
Resistance stacks first at the $0.5401 zone, then $0.7690. Support sits at $0.2761, backed by the BB lower band near $0.2584, with a deeper floor at $0.2222 and a support zone at $0.1683.
Daily RSI reads 69.42. That's warm, not extreme. When we pulled up the chart, what stood out was not the candle itself; it was how sharply RSI snapped up from the low-30s just a few weeks back.
A daily close above $0.5401 would confirm the breakout is extending. Losing $0.2761 fast would flip that read.
CYS Technical Analysis: Weekly Chart
Zoom out and the weekly chart tells a different story. $CYS spent months compressing inside a symmetrical triangle, and this week's candle pushed price toward the top edge of that pattern.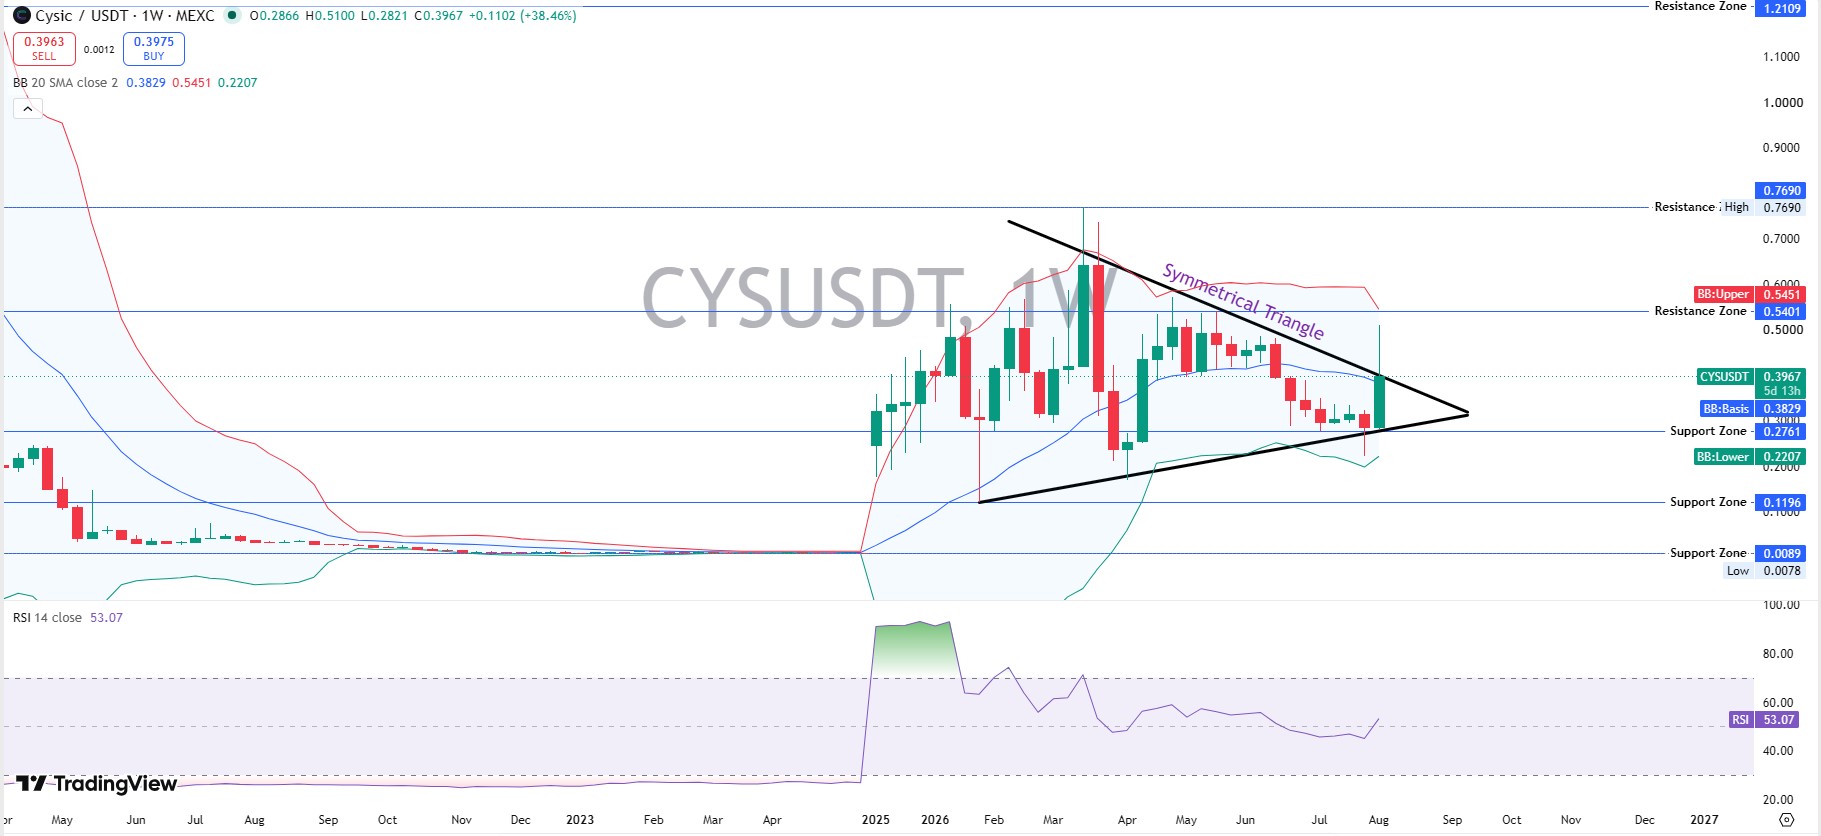
Weekly resistance runs at $0.5401, then a much wider gap up to $1.2109. Support sits at $0.2761, with a deeper zone near $0.1196, and the chart's extreme low print is near $0.0089, far below the current price.
Weekly RSI reads 53.07, still neutral. Turns out, a triangle breakout on neutral RSI tends to carry more follow-through than a spike from an already-hot daily read.
But nothing is confirmed until the price closes above resistance on a weekly basis.
CYS Support And Resistance Levels
Immediate support: $0.2761, then $0.2584, then $0.2222.
Immediate resistance: $0.5401, then $0.7690, then $1.2109. A weekly close above $0.5401 would confirm the triangle breakout has legs.
Cysic Price Prediction: Scenarios By Timeframe
Timeframe | Bull Case | Base Case | Bear Case |
24H | Holds above $0.39, tests $0.4500 (moderate) | Chops between $0.33-$0.42 (high) | Slips under $0.2761 (low) |
7D | Weekly close above $0.5401 opens $0.7690 (low-moderate) | Range-bound inside the triangle (high) | A daily close under $0.2761 confirms fade (moderate) |
Aug 2026 | Triangle resolution targets $0.65-$1.00 (low-moderate) | Drifts $0.28-$0.45 tracking altcoin flows (moderate) | Breaks toward the $0.125 all-time low zone (low) |
Invalidation for the bullish Cysic price prediction is a daily close under $0.2761.
CYS Tokenomics And Network Activity
Total supply sits at 1,000,000,000 CYS, matching max supply. The circulating supply reads 160.8M CYS, just over sixteen percent of the total, giving a market cap near $61.89M and an FDV near $388.37M, per CoinMarketCap.
Liquidity-to-market-cap runs at 2.32%. That's thin. Thin liquidity is exactly what turns a good move into a wild one.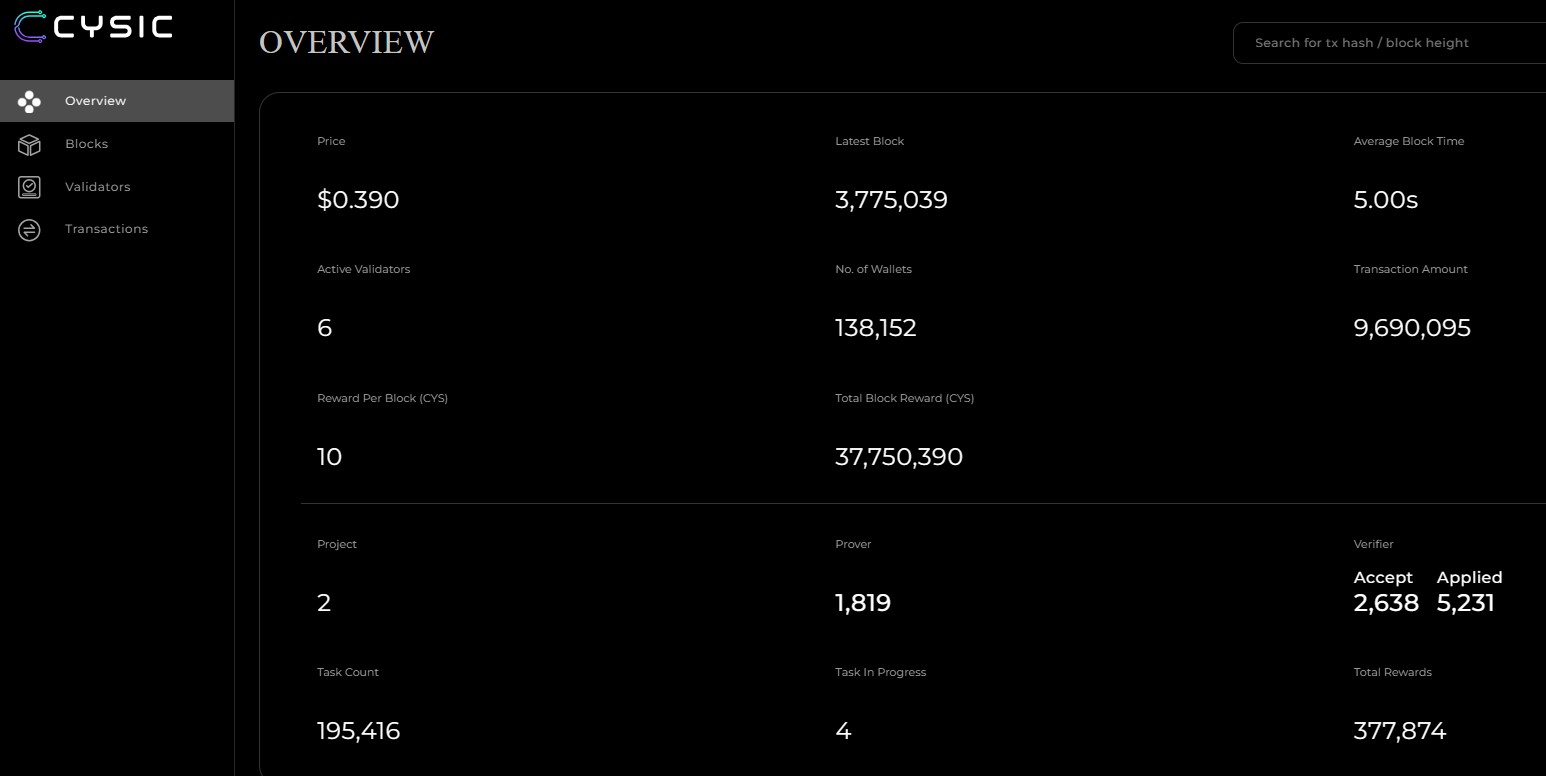
On-chain, the Cysic network explorer shows 138,152 wallets and 9,690,095 total transactions. Six active validators secure the chain, with a 5.00-second average block time and a reward of 10 CYS per block.
The proving side looks active too. There are 1,819 provers registered, and verifiers have accepted 2,638 of 5,231 applications, a fifty percent acceptance rate. Task count across the network sits at 195,416.
CertiK rates the project 4.4 out of 5. That's a decent trust signal for a token still under a year old.
Liquidations And Exchange Volume
Per CoinGlass, 24-hour liquidations hit $540.20K, split between $280.07K in longs and $260.13K in shorts. Longs took the slightly bigger hit.
Binance carries by far the heaviest volume at $66.99M, with Bitget near $11.73M and Bybit close behind at $11.22M. MEXC and Gate trade smaller slices.
That's real derivative interest building around a mid-cap infrastructure name, and it's worth checking against how a major like Bitcoin is trading right now for broader context.
CYS And The Decentralized AI Altcoin Narrative
Cysic is not a meme chart riding a joke. It's a zero-knowledge proving network built for verifiable compute, positioning itself inside the decentralized AI and zk-infrastructure altcoin narrative.
That framing tends to pull fresh capital in whenever broader altcoin risk appetite improves. And a 34% daily move on a sub-$65M market cap does not automatically mean the trend has turned.
This is exactly why Cysic price prediction 2026 search interest keeps climbing alongside broader CYS crypto price prediction coverage. Demand for the story is outrunning the float right now.
Related infrastructure and AI token setups get their own coverage on the AI crypto news hub for anyone comparing narratives.
Market Outlook: Risks And Catalysts
Thin liquidity tops the list of risks here. A 2.32% liquidity-to-market-cap ratio means large orders can move price fast in either direction.
A break below $0.2761 would put CYS back on track toward its $0.125 all-time low, set January 30, 2026. That's a real possibility, not a scare tactic.
Macro matters too. A softer Fed rate decision tends to lift risk appetite across small and mid-cap altcoins broadly, CYS included.
The August 6 AMA is worth watching closely. Cysic's own team has signaled new decentralized AI announcements are coming, and that's the kind of event that can extend or kill a breakout fast.
Staying current on broader crypto news tends to flag catalysts before they hit price.
Anyone comparing CYS against other 2026 setups can browse the price prediction hub for added context.
It's worth a glance at exchange listing trackers before assuming liquidity is deep everywhere new pairs go live.
Glossary
RSI (Relative Strength Index): A momentum indicator from 0-100. Above 70 usually signals overbought; below 30 signals oversold.
FDV (Fully Diluted Valuation): What the market cap would be if all 1B CYS were circulating today.
Liquidity-to-Market-Cap Ratio: How much tradeable liquidity exists relative to total market value. Lower means thinner, more volatile trading.
Higher-Low: A chart pattern where each pullback bottoms out above the last one, often a sign of building strength.
Methodology
Chart levels came from the CYS/USDT daily and weekly charts on MEXC via TradingView, using RSI-14 and 20-period Bollinger Bands, captured on August 4, 2026, around 09:00 UTC. Price, supply, and market-cap data came from CoinMarketCap and were also captured on August 4, 2026, around 09:00 UTC. Network and wallet activity came from the official Cysic explorer. Liquidation and volume figures came from CoinGlass.
Disclaimer
This is speculative market commentary, not financial or investment advice. Crypto assets are volatile and can lose most or all of their value. Verify live figures before trading.


















