Avalanche Price Prediction: AVAX Eyes Next Big Move


$AVAX is trading at $6.664 right now, and honestly, the last couple of weeks have felt like watching paint dry after months of a strong uptrend.
Price rallied hard, then just stopped, and has been chopping sideways inside a tight box ever since.
This kind of pause after a strong move often signals that the market is preparing for its next directional move. A bigger decision is coming.
This Avalanche price prediction breaks down exactly where AVAX could go once it finally picks a direction and what the transaction data happening behind the scenes is suggesting.
AVAX Price And Market Snapshot Right Now
Metric | Value |
Price | $6.664 |
24h Change | +2.43% (+$0.1578) |
Market Cap | $2.87B |
Futures Volume (24h) | $372.84M |
Spot Volume (24h) | $20.27M |
Open Interest | $237.87M |
Circulating Supply | 431.77M AVAX |
Total Supply | 463.44M AVAX |
Max Supply | 715.74M AVAX |
Live Avalanche market data and price tracking show AVAX holding steady with a solid green day, and you can also follow it on Avalanche coin overview and stats for a broader picture of where AVAX stands right now.
Source: Data from CoinGecko as of 21/07/2026. Figures may vary slightly across other tracking websites.
Why Avalanche Daily Transactions Are Exploding Right Now
Something interesting is happening under the surface that most people are missing. 
According to on-chain data, Avalanche daily transaction growth over the past year has basically gone one direction only; since the second quarter of 2025, AVAX has been doing roughly 300,000 transactions a day.
Fast forward to July 13 this year, and there was a single-day spike of around 6.2 million transactions, which works out to almost 20 times growth in a little over a year.
That's not a small number. Network activity like this usually builds up quietly in the background long before price catches up to it.
It doesn't guarantee a rally, but it does show real usage is climbing fast, and that's usually a healthy sign for the long run, even while the price sits still for now.
Avalanche Liquidation Data Shows Shorts Taking The Bigger Hit
Looking at the Avalanche liquidation data today, the pressure has clearly been on short sellers across almost every timeframe.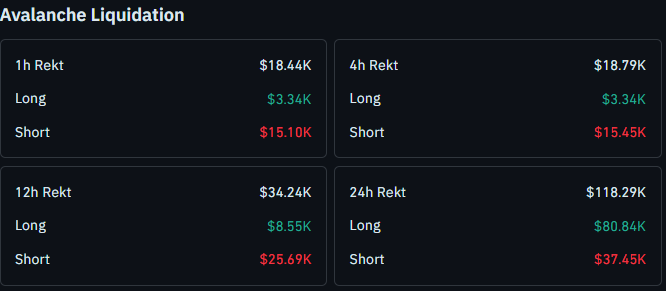
On the shorter timeframes, short positions are getting wiped out far more than longs, which lines up with AVAX holding firm instead of breaking down.
But zoom out to the full 24-hour window, and longs actually take the bigger share at $80.84K against $37.45K in shorts, which tells you this range has been shaking out traders on both sides rather than favoring one direction cleanly.
Avalanche Price Prediction Chart Analysis On the 4-hour timeframe
Looking at the 4-hour $AVAX chart, price spent weeks climbing inside a channel before finally slowing down and dropping into a sideways range roughly between the $6.35 and $6.80 zones.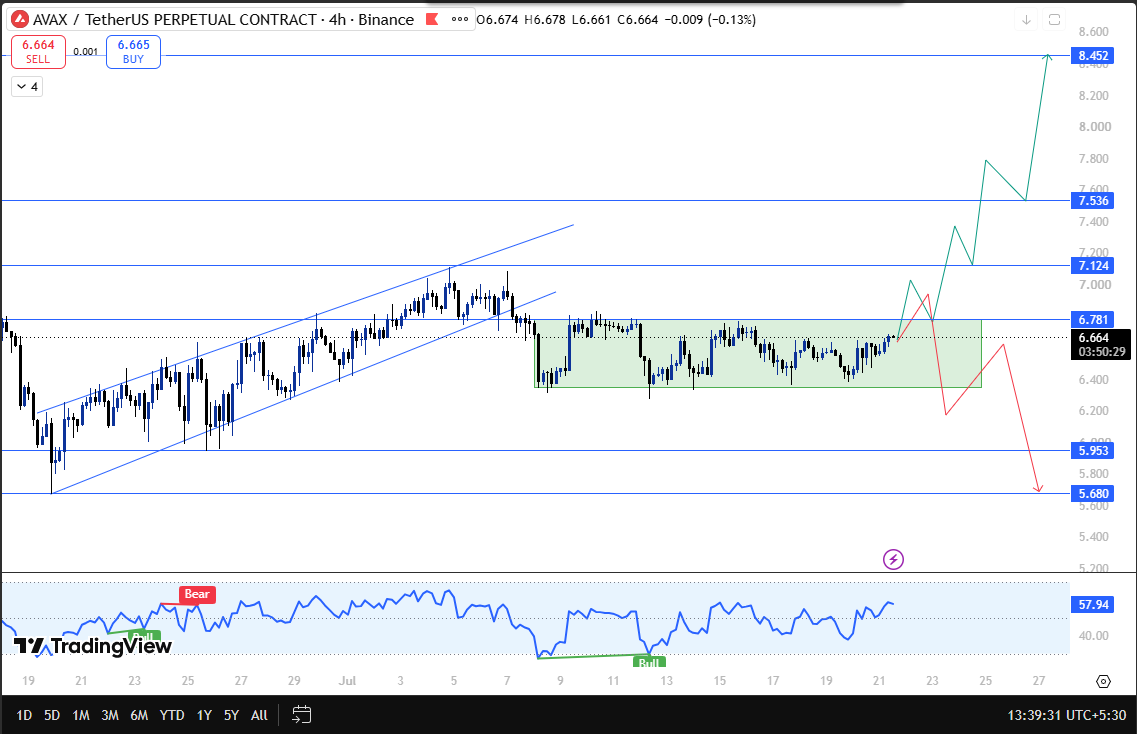
This is a classic range-bound consolidation phase, the kind of pause that usually shows up after a strong trending move, and it's exactly the setup covered in the earlier piece on AVAX being stuck in a range with key breakout levels.
Right now the price is pressing against the upper edge of that range near $6.78.
If AVAX manages to close above this zone and hold, the next resistance levels line up at $7.124, then $7.536, and a bigger extended target sits up at $8.452.
This kind of breakout scenario was also the main focus of the $AVAX range-bound rally and next target breakdown.
On the flip side, if this range fails and $AVAX slips back below the lower boundary near $6.40, the setup flips bearish, and the next supports to watch fall at $5.953, followed by $5.680.
RSI on this timeframe is currently reading 57.94, sitting in a fairly neutral to mildly bullish zone.
It's worth noting RSI dipped into bearish territory back in late June before recovering, and that earlier bounce lines up with where price started building this current range, which adds a bit more weight to the idea that buyers stepped back in at the right spot.
Avalanche Technical Snapshot
Indicator | Signal |
Trend | Range bound, awaiting breakout |
RSI | 57.94, neutral to mildly bullish |
Structure | Consolidation after prior uptrend channel |
Liquidations | Shorts squeezed on shorter timeframes |
Network Activity | Transaction count up nearly 20x in a year |
AVAX Support And Resistance Levels To Track This Week
Type | Level | Note |
Resistance 3 | $8.452 | Extended bullish target |
Resistance 2 | $7.536 | Mid-range breakout target |
Resistance 1 | $7.124 | Immediate resistance above range |
Current Price | $6.664 | Trading near upper range boundary |
Support 1 | $5.953 | First downside target on breakdown |
Support 2 | $5.680 | Deeper downside support |
Avalanche Risk Reward Setup For Traders Watching This Range
Case | Trigger | Target |
Bull Case | Confirmed close above the range near $6.80. | Move toward $7.124, $7.536, and $8.452 |
Bear Case | Confirmed close below the range near $6.40 | Slide toward $5.953 and $5.680 |
Avalanche Price Prediction Invalidation Level
This setup stays neutral to bullish as long as $AVAX keeps holding inside its current range. If the price closes convincingly below roughly $6.40 on the 4-hour chart, that would break this consolidation structure and shift the near-term bias toward $5.953 and then $5.680.
Historical Context Behind This Avalanche Consolidation Phase
What makes this range worth watching is that it's forming right after a genuinely strong uptrend, not after a random pump.
The price climbed steadily inside a clean rising channel for weeks before pausing here.
That kind of pause after real strength often ends with continuation rather than a full reversal, though it always needs confirmation before anyone should treat it as settled.
You can browse more Avalanche price prediction coverage and updates for how this range has been tracked over recent sessions.
Avalanche Glossary For Understanding This Price Setup
Range Bound Market: A phase where price moves sideways between a defined support and resistance instead of trending in one direction.
RSI (Relative Strength Index): A momentum indicator that shows whether an asset has moved too far too fast, helping spot overbought or oversold conditions.
Open Interest: The total value of active derivative contracts like futures that haven't been closed yet.
Liquidation: When a leveraged position gets force-closed because the trader's margin ran out.
Breakout: When price moves decisively beyond a known support or resistance zone, often with rising volume.
Expert View On Avalanche AVAX Price Outlook
From a CoinGababar technical perspective, $AVAX points out that a tight range forming after a strong uptrend is usually a pause, not a reversal, especially when it comes alongside genuinely rising network usage like the transaction growth AVAX has shown over the past year.
Short sellers getting squeezed on the shorter timeframes adds a bit more weight to the idea that dip buyers are still active.
That said, nothing here is confirmed until the price actually breaks and closes outside this range.
A clean move above $6.8 would open the path toward $7.124 and eventually $8.452, while a breakdown below $6.4 would flip the picture toward $5.953 and $5.680.
Disclaimer
This article is for informational purposes only and should not be considered financial advice. Cryptocurrency markets are highly volatile, and price predictions are not guaranteed. Please do your own research before making any investment decisions.
Also read:

















