Avalanche Price Prediction: AVAX Stuck in Range, Next Breakout Ahead?


AVAX is quietly buzzing across trading communities right now, stuck in a consolidation area that has traders debating which way it breaks next.
Avalanche positions itself as a fast, scalable smart contract platform built for custom blockchain networks and decentralized apps, according to the project's own materials.
This Avalanche Price Prediction looks at what this consolidation could mean for AVAX going forward. Stick around till the end to see what the charts are hinting at next.
Avalanche Price Prediction 2026: Market Overview
Metric | Value |
Current Price | $6.6156 |
7 Day Change | -0.4% |
24h Move | $6.39 - $6.64 |
All Time High | $144.96 (-95.4%) |
Market Cap | $2.855B |
Outstanding Token Value | $2.877B |
Fully Diluted Valuation | $3.064B |
24h Trading Volume | $236.431M |
Circulating Supply | 431.772M AVAX |
Outstanding Supply | 435.105M AVAX |
Total Supply | 463.441M $AVAX |
Max Supply | 720M $AVAX |
Total Treasury Holding | 13,800,000 $AVAX |
Source: Data from CoinGecko as of 20/07/2026. Figures may vary slightly across other tracking websites.
Why Is AVAX Price Sideways Right Now
Report from BSCNews compared stablecoin growth across chains and noted that Aptos's stablecoin supply is up 6.3% this week to around $1.16 billion, which puts Aptos about $435 million behind Avalanche on total stablecoin supply. 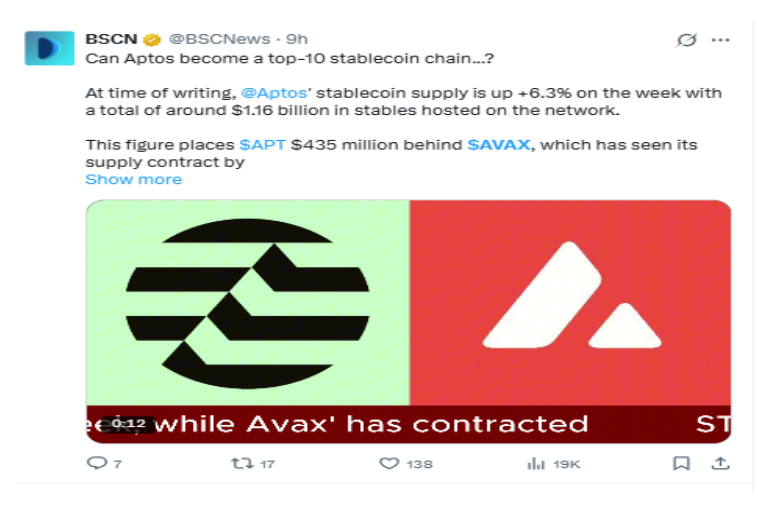
The same report pointed out that Avalanche's own stablecoin supply has been contracting recently.
This is a third-party comparative observation rather than a direct price catalyst, so it should be read as background context on Avalanche's ecosystem standing, not as the reason AVAX is stuck in its current consollidation area.
With no single confirmed news event driving price action, this consolidation looks more like a natural pause after AVAX's sharp move earlier in July than a reaction to any one headline.
AVAX price forecast: AVAX price chart analysis
AVAX rallied hard along with a rising trendline in early July before falling sharply with the EMA crossover once that trendline gave way.
Since then, the price has settled into a clear consolidation range, moving between the top and bottom of that consolidation area for several days without a clean break in either direction.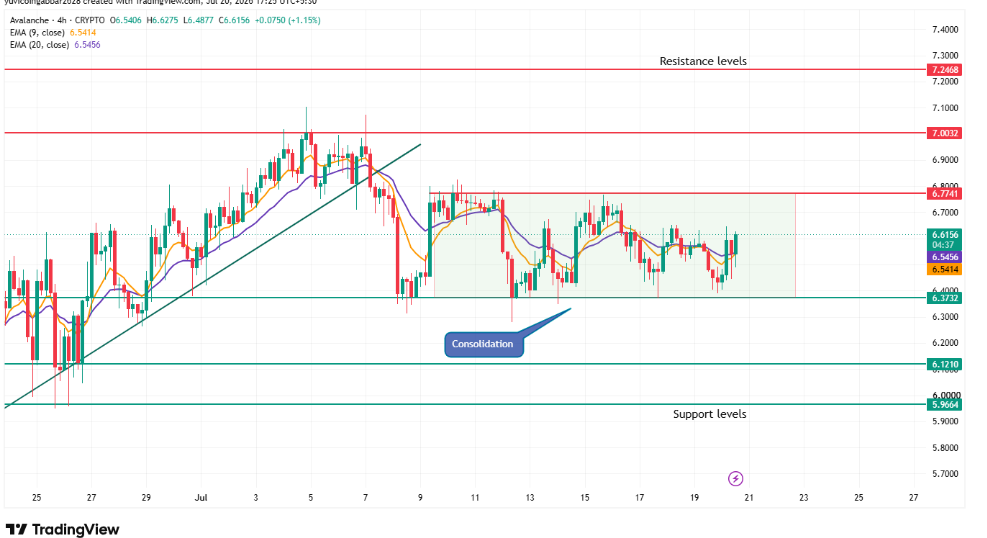
EMA 9 sits at $6.5414 and EMA 20 sits at $6.5456, sitting extremely close together right now. This kind of tight bunching usually signals the market is undecided, and it often comes before a bigger move once the consollidation area finally resolves.
Level Type | Price |
Resistance | $7.2468 |
Resistance (closer) | $7.0032 |
Resistance (range top) | $6.7741 |
EMA 20 | $6.5456 |
EMA 9 (initial recovery level) | $6.5414 |
Immediate price reference | $6.6156 |
First confirmed support (range bottom) | $6.3732 |
Deeper support | $6.1210 |
Deeper support (lower) | $5.9664 |
Verdict: a close above $6.7741 would be the first sign of a break higher out of this range. A close below $6.3732 would open the door toward the lower support levels instead.
Two Reader Takeaways
For existing holders, the level to watch is the range bottom at $6.3732. A close below that would mean the range is breaking down rather than just holding steady.
For anyone considering an entry, it may be safer to wait for a clear close above $6.7741 rather than buying inside a range that has already trapped other traders on both sides.
Avalanche Market Outlook: Expert View
According to CoinGabbar analysts, the bull case here needs a close above $6.7741, ideally with the EMA 9 and EMA 20 separating cleanly upward, showing buyers are stepping back in with conviction.
The bear case needs a close below $6.3732, which would put the $6.1210 support zone to the test next. With the EMAs bunched this tight, the next big candle out of this range could carry real weight for where AVAX heads from here.
















