Bedrock Price Prediction: Can $BR Hold Gains After a 56% Rally


Sometimes a chart just breaks, and nobody saw the note coming. That is more or less what happened to Bedrock this week, and traders are still catching up.
Bedrock Breaks Out: Why Everyone Is Suddenly Watching BR
A quiet liquid restaking token does not usually jump double digits overnight, and that is exactly why this move got attention. Bedrock price prediction chatter picked up fast once the token cleared a multi-month descending channel on heavy volume. Traders who had written BR off after months of sideways grinding are back at their screens.
Here's the thing: breakouts like this either turn into real trend changes or they snap back just as quickly. And right now, BR sits at a point where both outcomes are still alive. What tipped the scales this time, and can it last?
Key Takeaways
BR is trading near $0.2141, up 56.75% over 24 hours, per CoinMarketCap data captured around 09:00 UTC on August 12, 2026.
The 4H chart shows a clean breakout above a descending channel that had capped the price since June.
RSI on the 4H timeframe sits at 86.45, deep in overbought territory.
Whale concentration is extreme: 37 wallets, just 0.05% of holders, control 98.27% of supply.
Nearest resistance sits near $0.2263, with major support at $0.1183.
Where BR Trades Right Now
As of the latest snapshot on Bedrock's CoinMarketCap page, BR changes hands at $0.2141, up 56.75% in a day, with market cap near $64.58 million and 24-hour volume of $4.8 million, up 131% on the day.
On MEXC's BRUSDT pair, the 4H candle printed a high of $0.2217, an intraday move of roughly 74.70%. The circulating supply sits at 301.66 million BR against a 1 billion max supply, and the holder count has climbed past 88,000.
Why Is Bedrock Price Moving Today?
But no rally happens in a vacuum. Turns out, this one lines up with a broader liquid-restaking rotation, where capital chasing ETH and BTC staking yield has been sniffing out smaller-cap names with real TVL behind them.
Bedrock's uniBTC and uniETH products still anchor its story. When we pulled up the volume data, one thing jumped out: Binance alone processed $30.10 million of BR volume, dwarfing every other venue combined.
Whale wallets likely front-ran retail here. That is a pattern, not proof, but it fits.
Bedrock Price Prediction: Chart Analysis
On the 4H TradingView chart, BR snapped a descending channel that had held since late June, with the breakout candle carrying unusual volume.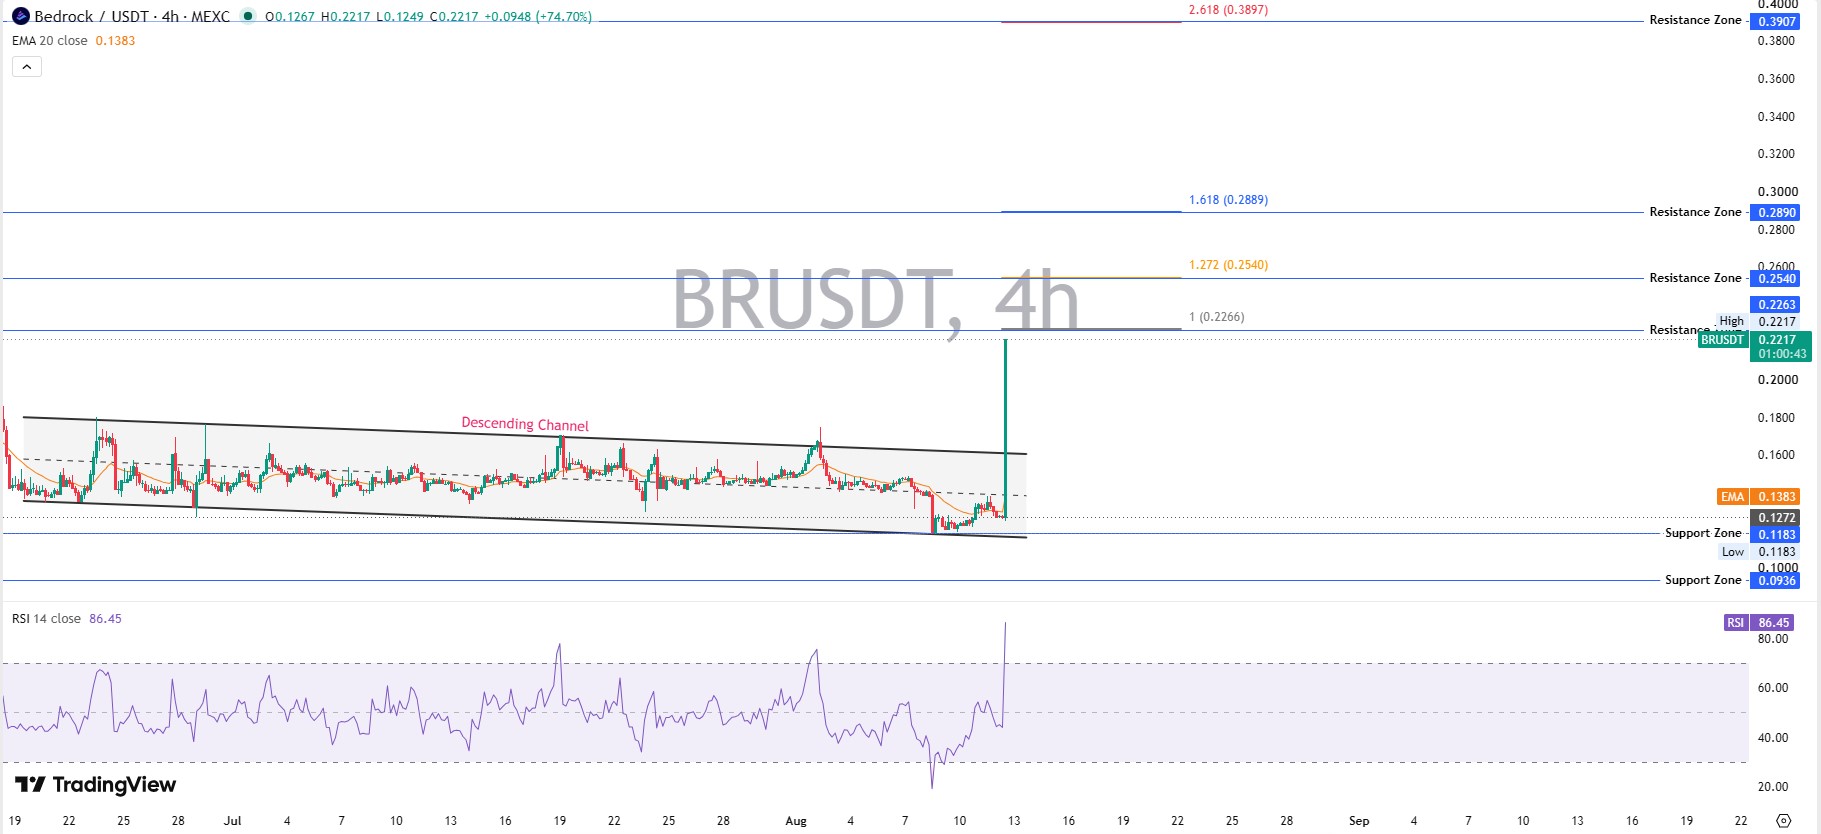 EMA 20 sits far below the spot at $0.1383, confirming the move is stretched, and RSI at 86.45 flags an overbought short-term condition, meaning a pullback toward $0.1817 to $0.1183 wouldn't be shocking before any fresh push higher.
Zooming out on the same structure, BR remains well below its April 2026 all-time high of $0.2572, still recovering from a steep 2026 drawdown off the $0.039 low. A close above $0.2263, the first Fibonacci extension level, would be the strongest signal yet that the broader downtrend is actually over, not just paused.
Support, Resistance and Key Levels
Immediate resistance clusters at $0.2263, then $0.2540 and $0.2890, with a stretch target near $0.3907 on continued momentum. On the downside, $0.1183 is the first real support, and $0.0936 backs it up. A daily close back under $0.1183 would undercut the bullish structure fast.
Tokenomics and Supply Risk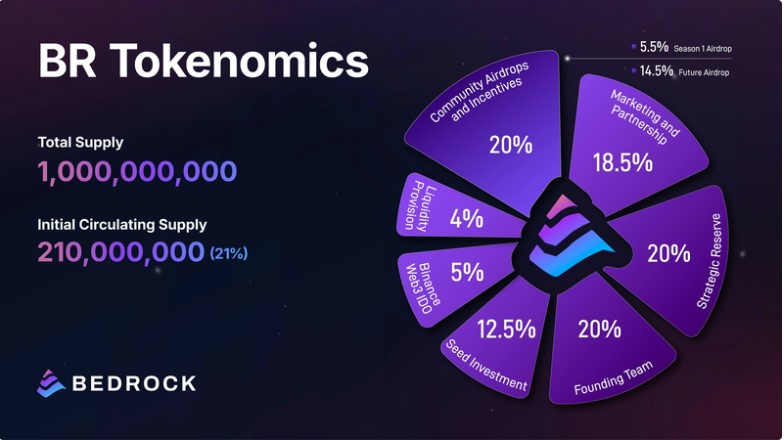
Total supply is capped at 1 billion BR, with an initial circulating supply of just 210 million, or 21%. The founding team holds 20%, locked two years with 24-month vesting after; seed investors hold 12.5% under a similar schedule. Community airdrops and incentives account for another 20%, vesting over five years. That is a lot of future unlock pressure sitting behind today's price.
BR Whale Concentration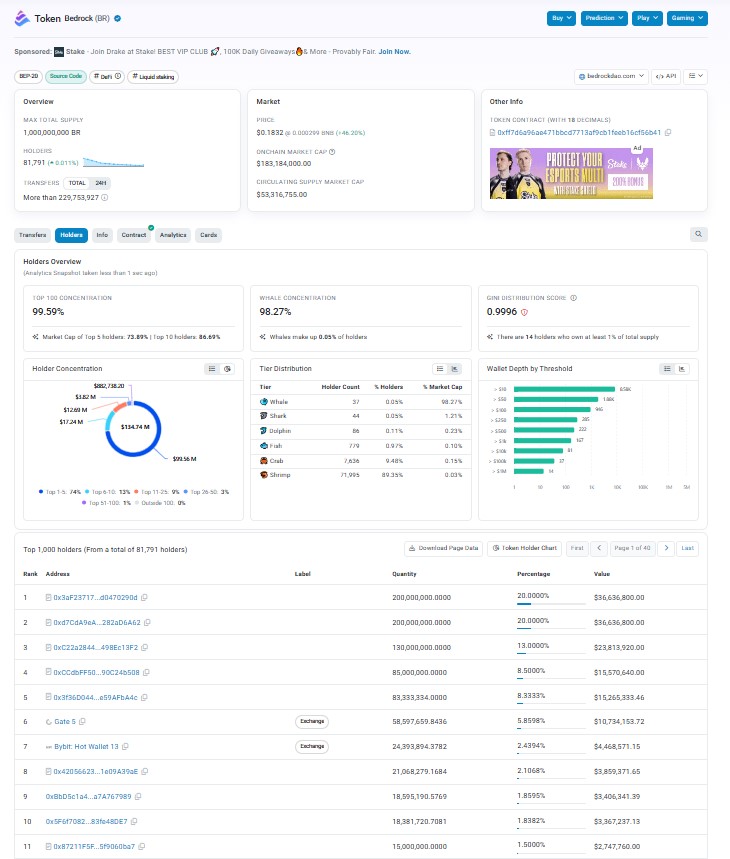
Here's the thing: per BR holder data on BscScan, 37 wallets, or just 0.05% of holders, control 98.27% of the supply, and the Gini score reads 0.9996, close to maximum inequality. Top 10 wallets alone hold 86.69%. Two of the largest are labeled exchange wallets, Gate and Bybit, meaning some of that "whale" balance is really just custodial. But concentration this tight means a handful of wallets can still move price violently in either direction.
Where Bedrock Fits Among Restaking Altcoins
Bedrock competes in a crowded liquid-restaking field alongside bigger names, and its edge is Bitcoin-focused staking through uniBTC rather than pure Ethereum restaking. That niche matters for anyone tracking altcoin price cycles and rotation patterns across the broader crypto news cycle this quarter.
Liquidity, Volume and Liquidations
CoinGlass data shows 24-hour liquidations of $197.93K, split between $74.51K in longs and $123.41K in shorts, meaning short sellers got squeezed as the breakout ran. The liquidity-to-market-cap ratio sits at a thin 1.81%, per the same CoinGlass BR dashboard, so large orders can still move the price prediction outlook quickly in either direction.
Bedrock Price Forecast: Bear, Base and Bull Scenarios
Scenario | Target | Probability | Key Level | Invalidation |
Bear | $0.1183 | 30% | Loses $0.1817 support | Daily close below $0.1183 |
Base | $0.2263 | 45% | Holds above $0.1817 | Fails to reclaim $0.2263 twice |
Bull | $0.2890 | 25% | Clears $0.2263 with volume | Rejection at $0.2540 |
Probabilities reflect the extreme RSI reading and thin liquidity, not a guaranteed outcome.
Risks to Watch
Whale concentration remains the biggest single risk, alongside a thin order book that amplifies both pumps and dumps. Team and seed-investor unlocks over the coming years add steady sell pressure, and the BEP-20 contract was last audited by Blocksec back in March 2025, so check the audit report page before sizing any position. None of this is investment advice.
Disclaimer
This article is for informational purposes only and does not constitute financial, investment, trading, or legal advice. Bedrock (BR) is a volatile, low-liquidity altcoin, and prices can move sharply in either direction within minutes.
The bear, base, and bull scenarios above are analytical estimates based on chart structure and available data, not guarantees, and probabilities can shift as new information emerges. Always do your own research, verify data directly from primary sources such as CoinMarketCap and CoinGlass, and consult a licensed financial advisor before making any investment decision. Never invest more than you can afford to lose.
Also read:

















