Bitcoin Price Eyes $74K as Chart Pattern Forms, Strategy Cools


Bitcoin is trading near $63,900 to $64,000 this week, sitting far below its October 2025 all-time high of $126,198. The drop has traders watching the charts closely for a sign of what comes next.
Some analysts say a short dip to $60,000 might actually help the asset. It could complete a well-known bullish setup on the charts. Others are watching corporate buyers like Strategy, who just posted mixed quarterly numbers.
What is the inverse head-and-shoulders pattern in Bitcoin's chart?
Crypto analyst Ali Charts pointed to a 12-hour $BTC chart showing an inverse head-and-shoulders formation. This pattern often signals a trend reversal from down to up.
The "head" of the pattern already formed near lower price levels. Now, a "right shoulder" near $60,000 would complete the setup.
According to the chart shared by Ali Charts, a confirmed breakout above $66,500 would open the door toward $74,000. That would mark a solid recovery from current levels.
This is not a guarantee. Chart patterns can fail, and Bitcoin has broken expectations before, both to the upside and downside.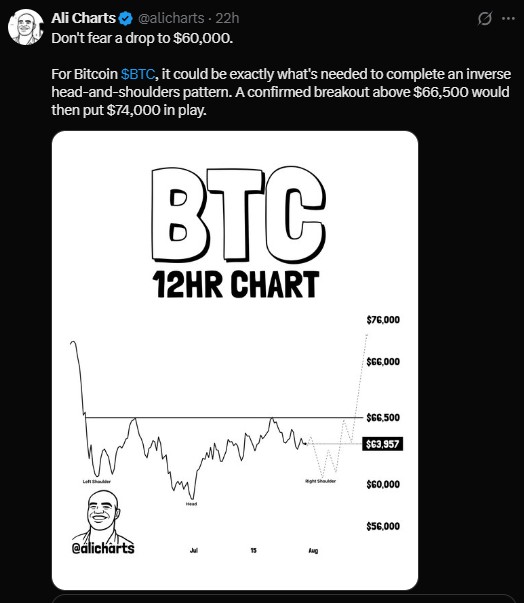
Why did Strategy pause its Bitcoin buying streak?
Strategy, the largest corporate BTC holder, has not bought BTC in five straight weekly filings. That is the longest pause since the company started buying in August 2020.
As of the latest filing, Strategy holds 843,775 BTC. Its average cost basis is $75,476 per coin. That means the entire holding is currently underwater compared to today's spot price.
Metric | Value |
BTC Spot Price | $63,900–$64,000 |
Strategy BTC Holdings | 843,775 BTC |
Avg. Cost Basis | $75,476 per BTC |
Aggregate BTC Cost | $63.69 billion |
Current BTC Value | ~$54.0 billion |
USD Reserve | $3.75 billion |
MSTR Market Cap | ~$35.70 billion |
Instead of buying more coins, the company shifted focus. It built up a $3.75 billion cash reserve and cut convertible debt by 18%, bringing it down to $6.7 billion.
Strategy also introduced new metrics like BTC Hurdle ARR and Net BTC Per Share. These are meant to reassure investors about the health of its preferred stock offerings.
How has MSTR stock performed compared to Bitcoin?
MSTR shares are down 75% over the past twelve months, now trading around $97.74. That is a steep fall from its November 2024 peak of $543.
The stock used to trade at a big premium above the value of its Bitcoin holdings. That premium has shrunk a lot as investors reassess the company's balance sheet moves.
What did Michael Saylor say about Bitcoin adoption?
Michael Saylor, Strategy's chairman, remains confident about Bitcoin's long-term path. He recently said governments can slow Bitcoin adoption but cannot stop it entirely, describing the growth as happening "block by block, nation by nation."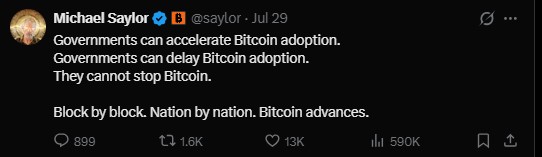
He also compared Bitcoin's entry into traditional finance to a Trojan horse quietly moving into Wall Street. The comment points to growing institutional exposure through ETFs and corporate treasuries, even amid short-term price weakness.
Bitcoin price outlook for the coming weeks
BTC sits at a key decision point. A drop toward $60,000 could set up the right shoulder of the chart pattern analysts are watching.
A confirmed move back above $66,500 would be the signal bulls want to see. That could open a path toward the $74,000 area mentioned in recent chart analysis.
On the other hand, continued weakness or a break below $60,000 support could delay any recovery. Strategy's buying pause also removes a steady source of demand that the market had gotten used to.
Traders should watch both the technical levels and corporate treasury behavior in the weeks ahead.
Disclaimer
This article is for informational purposes only and does not constitute financial, investment, or trading advice. Cryptocurrency markets are highly volatile and risky. Always do your own research and consult a licensed financial advisor before making investment decisions.
1 month ago
i have a problem with my dogecoin in wallet, i lost over $50,000 last week trying to investment not knowing i was investing with a scammer when the times comes for me to withdrawal my savings it was no where to be found then a friend ask me to contact SYLVESTER BRYANT at Yt7cracker@gmail. com if i am serious in getting all what has been stolen from me , After contacting him i follow his procedures and instruction after some time he was able to recover back my stolen dogecoin and also apprehend the scammer












.jpg)






