Bitcoin Price Prediction August 2026: Death Cross vs $116K Hopes


Bitcoin is sitting at a crossroads this week. The Bitcoin Price Prediction August 2026 conversation is split down the middle right now, and the charts explain why.
BTC has been trading near $63,000 to $65,000 in late July 2026. That is down from highs above $126,000 seen earlier this year. Traders are watching a few different signals at once. Some point to more pain ahead. Others point to a huge breakout close by.
How could the Fed meeting affect Bitcoin in August 2026?
The Fed meeting on 29 July 2026 lands right before this window begins, and it could set the tone for everything else.
Current target rate probabilities show a 64.2% chance of no change to rates, still sitting at 350 to 375 basis points, while 35.8% of the market is pricing in a hike toward 375 to 400 basis points. There is basically a 0% chance of a rate cut priced in right now.
That split matters for risk assets like Bitcoin. A no-change outcome, which is the more likely scenario, would probably keep BTC trading in its current range without a big shock either way.
A surprise hike, even a small one, tends to hit crypto and other risk assets harder since it signals the Fed is still fighting inflation instead of easing up.
With this decision landing right before August begins, it could tilt Bitcoin toward the death cross downside case or the wedge breakout upside case discussed below.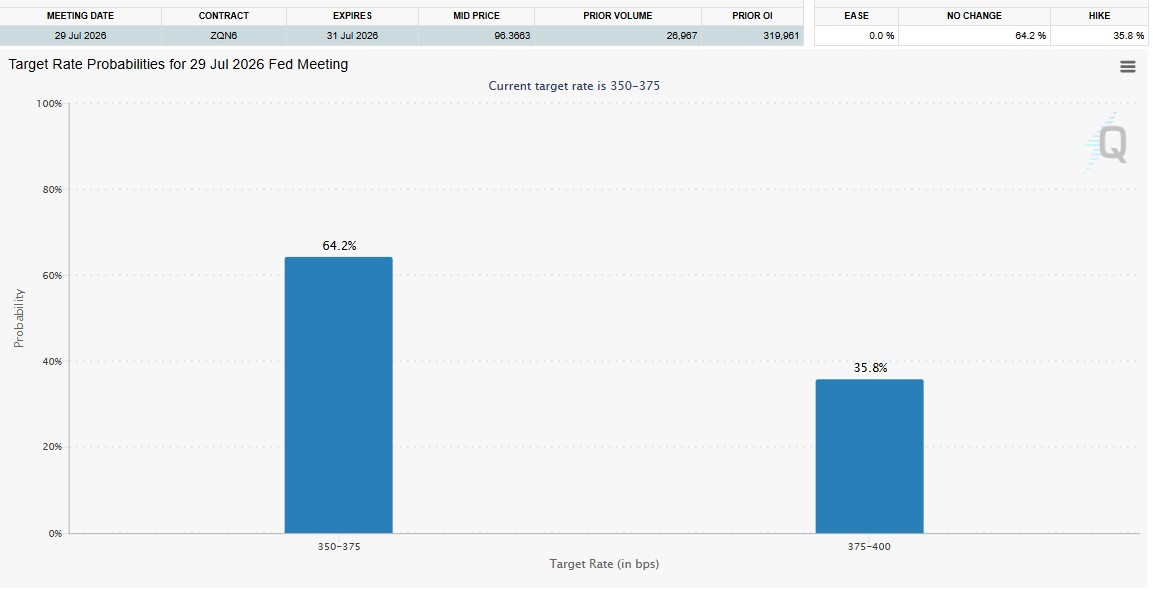
What is a death cross and why does it matter for Bitcoin?
A death cross happens when the 50-day moving average crosses below the 100-day moving average.
Analyst Crypto Rover flagged this pattern on the weekly chart, pointing out that the last time it formed, BTC dropped roughly 30% afterward.
The chart shared shows two prior death cross events. Each one was followed by a drop close to 30%, marked at -30.29% and -30.01% on the weekly candles.
If history repeats, some traders worry this could pull Bitcoin toward the $45,000 to $48,000 zone.
Death crosses do not always play out the same way twice. They are lagging signals, meaning the damage has often already happened by the time the cross confirms. Still, the pattern is worth watching closely into August.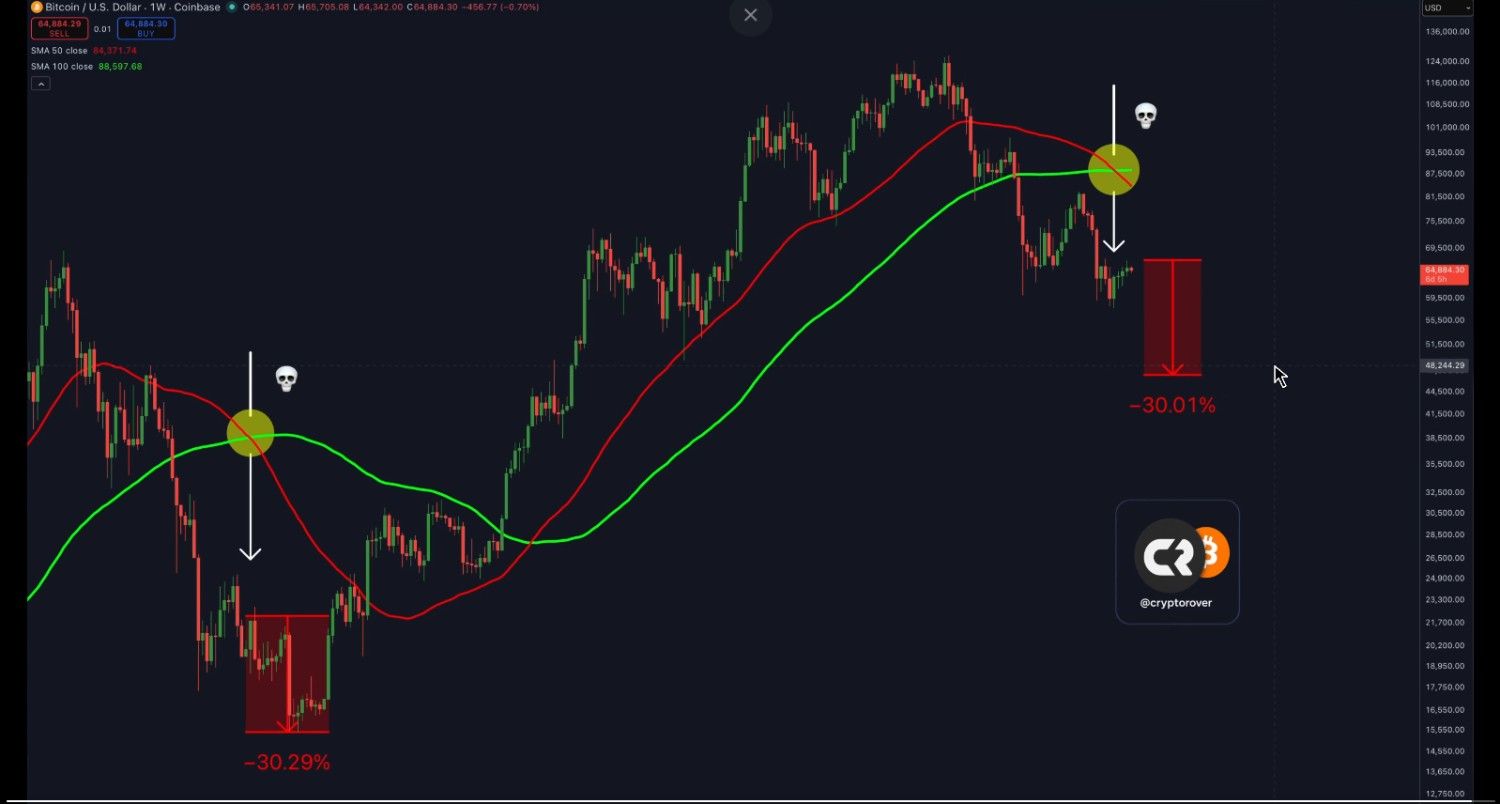
Does August history favor bulls or bears for BTC?
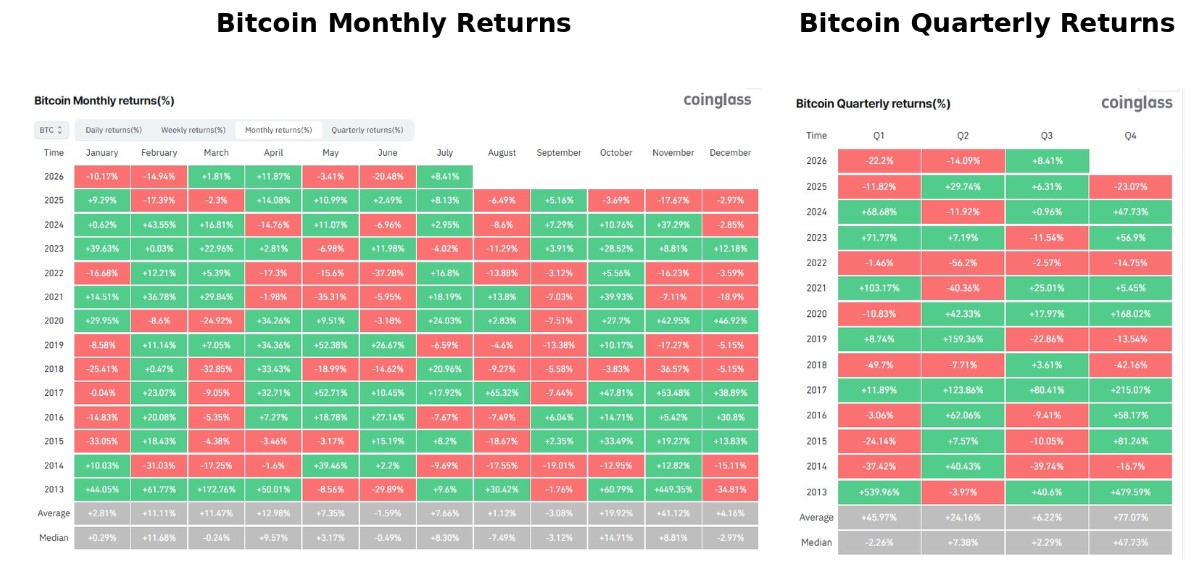
Coinglass seasonality data gives a mixed picture for August. Looking at monthly returns since 2013, August has been red more often than green. Numbers like -13.88% in 2022, -11.29% in 2023, and -9.27% in 2018 stand out as rough months.
The average August return sits at +1.12%, while the median is a weaker -7.49%. That gap tells you a few strong Augusts pulled the average up, but most years actually finished the month lower.
Quarterly data adds more context. Q3 has an average return of +6.22% and a median of +2.29%, which is far calmer than Q2 or Q4 swings. This suggests August and September together tend to be a chop zone rather than a clean trend month.
Is Bitcoin forming a bullish falling wedge pattern?
Not every chart points down. Analyst Javon Marks shared a falling wedge setup on BTC, a pattern that often signals a reversal to the upside after a long decline.
According to that chart, a successful breakout above the wedge could first target around $116,000, with all-time highs as the next stop after that.
This lines up with the idea that Bitcoin's recent pullback could be a shakeout before another leg higher, not the start of a deeper bear phase.
The catch is that falling wedges need volume and a clean breakout to confirm. Right now BTC has not broken cleanly above the pattern, so this remains a setup to watch rather than a confirmed move.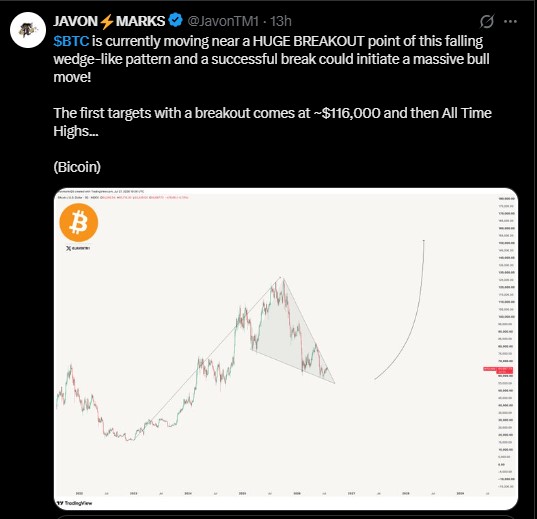
Bitcoin Monthly and Quarterly Returns Snapshot
Period | Average Return | Median Return | 2026 So Far |
January | +2.81% | +0.29% | -10.17% |
Q1 | +45.97% | -2.26% | -22.2% |
Q2 | +24.16% | +7.38% | -14.09% |
July | +7.66% | +8.30% | +8.41% |
August | +1.12% | -7.49% | Pending |
Q3 | +6.22% | +2.29% | Pending |
What are the key price levels to watch in August 2026?
Short-term support sits near $59,500 to $60,000 based on recent trading ranges. Below that, the next real floor is closer to $45,000 to $48,000, which lines up with the drop targets seen after past death cross events.
On the resistance side, BTC faces a wall near $67,500 to $70,000 first. A stronger cap sits near $84,000 to $88,000, where the SMA 50 and SMA 100 currently sit on the weekly chart.
A close below $59,500 would open the door toward the death cross target zone. A close back above $70,000 with strong volume would support the wedge breakout thesis and put $116,000 back on the table as a realistic medium-term target.
Bottom Line on Bitcoin Price Prediction August 2026
August 2026 looks like a tug of war between three forces. The death cross and weak seasonal history argue for caution and possible further downside.
The falling wedge and long-term structure argue for patience, since a breakout could still send BTC toward six figures again. Sitting in the middle is the Fed, whose rate decision could nudge Bitcoin toward either outcome.
Nobody knows which force wins yet. Watching how BTC reacts around $60,000 and $70,000 over the next few weeks, alongside how the market digests the Fed's move, should give a clearer answer.
Disclaimer
This article is for informational purposes only and does not constitute financial, investment, or trading advice. Cryptocurrency markets are highly volatile and unpredictable. Past performance, including historical seasonal data, does not guarantee future results. Always do your own research and consult a licensed financial advisor before making any investment decisions.