Bitcoin Cash Price Prediction: BCH Falls Below Support, Is $200 Next?


Bitcoin Cash is trending up, and traders can't stop watching the chart. Price pushed toward a key level, got rejected hard, and has been falling ever since, one lower low after another.
Right now BCH is trading near $223.65, and things could get even more interesting from here. This Bitcoin Cash Price Prediction covers what the chart pattern shows after this rejection.
What the liquidation data reveals about who's getting hurt in this move and the levels that matter if BCH keeps falling toward $200.
Bitcoin Cash is a peer-to-peer electronic cash system that forked from Bitcoin in 2017 to prioritize larger block sizes and lower transaction fees, according to the project's own materials.
Stay till the end; there's key info here that could shape your next move.
Bitcoin Cash Price Prediction: Market Overview
Metric | Value |
Current Price | $223.65 |
7d Change | -8.0% |
24h Range | $219.67 – $225.54 |
Market Cap | $4.483B |
Fully Diluted Valuation | $4.483B |
24h Trading Volume | $146.028M |
Circulating Supply | 20.062M $BCH |
Total Supply | 20.062M $BCH |
Max Supply | 21M $BCH |
Source: Data from CoinGecko
Bitcoin Cash Price Prediction: $BCH Liquidation and Volume Data
Long positions have absorbed nearly all the pain in this pullback.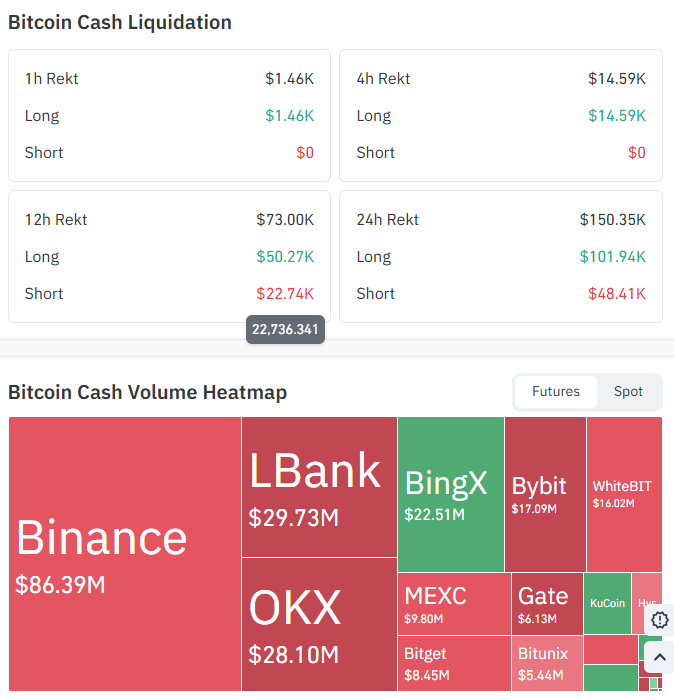
Over the last 24 hours, BCH saw $150.35K in total liquidations, with $101.94K from longs against just $48.41K in shorts.
That imbalance gets even more extreme on shorter windows: in both the 1-hour and 4-hour periods, every single dollar of liquidation came from long positions, with zero short liquidations recorded at all.
That's a clear sign leveraged buyers have been getting squeezed out consistently as this decline has played out.
Futures trading volume remains heavy despite the pullback, led by Binance at $86.39M, with meaningful volume also flowing through LBank, OKX, BingX, Bybit, WhiteBIT, Bitget, MEXC, Gate, and Bitunix.
That level of continued activity shows traders are still actively positioning around BCH rather than stepping away.
Bitcoin Cash Chart Analysis: Rounding Bottom, Rejected at Resistance
After an earlier sharp sell-off, BCH spent several weeks developing out a rounding bottom pattern, a gradual, curved recovery that often signals accumulation building after a sharp decline.
Price eventually broke out of that pattern and rallied hard but ran straight into the 200 EMA level and previous resistance at $250.56, where it was rejected.
That rejection has the look of a liquidity hunt, a move that swept stop orders and trapped late buyers near the top before reversing.
Since that rejection, BCH has broken out a series of lower lows and is now trading around $223.65, giving back a meaningful part of the earlier recovery.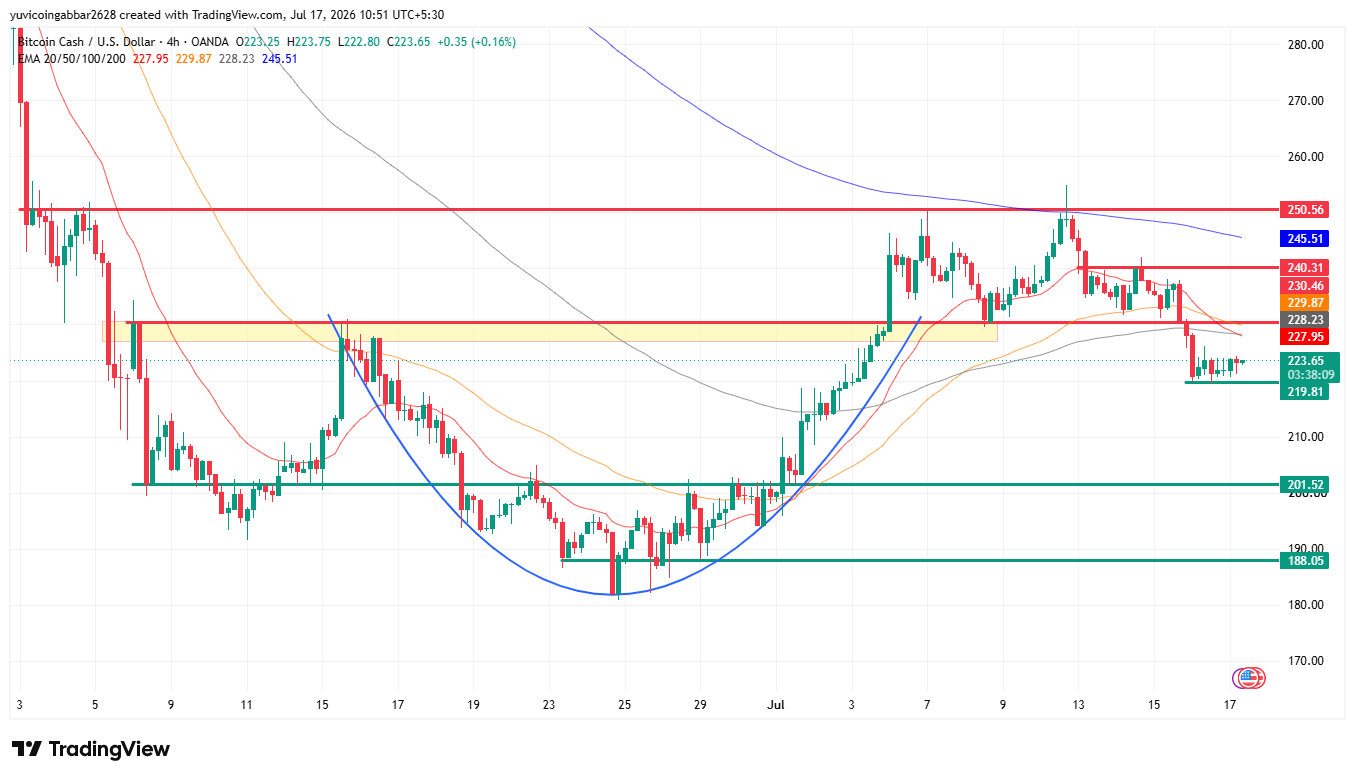
The nearest resistance above the current price is $230.46 from where the rounders pattern breaks out (neckline), and this level carries extra weight because it lines up closely with a bearish EMA crossover that's just formed.
The EMA 20 ($227.95) has slipped below the EMA 50 ($229.87), with the EMA 100 ($228.23) sitting in between, all three now clustering together just above price after crossing downward.
That kind of tight, crossed-over cluster typically signals fading short-term momentum.
The EMA 200 ($245.51) remains well above the current price, a reminder that the longer-term trend is still working against this recovery attempt.
Key Levels
Support | Resistance |
$219.81 | $230.46 |
$201.52 | $240.31 |
$188.05 | $250.56 |
Two Scenarios to Watch
Recovery Scenario
For BCH to stabilize, the price would need to reclaim $230.46, which also means clearing the bearish EMA cluster at the same time, making it a more meaningful confirmation level than a simple resistance line.
From there, $240.31 and eventually the previously rejected $250.56 come into focus.
Failure to clear $230.46 would keep the current downtrend intact.
Breakdown Scenario
Losing $219.81 would open the door to $201.52, and a deeper breakdown from there would put $188.05 in play.
Given how one-sided the recent liquidation data has been, with longs bearing nearly all the losses, a break of $219.81 could trigger another round of forced long liquidations.
Risk Note
BCH just experienced a clean rejection from a well-defined resistance level after a multi-week recovery attempt, and the one-sided long liquidation data shows leveraged buyers are still absorbing the damage. These levels should be treated as zones to watch, not guarantees, and position sizing should reflect the volatility this kind of rejection-and-reversal pattern can bring.
Bitcoin Cash Price Prediction: Expert View
According to CoinGabbar analysts, BCH's rejection at $250.56 after a genuine rounding bottom recovery is the key event shaping this chart right now.
The freshly formed bearish EMA crossover just above current price adds weight to the case that short-term momentum has turned.
A reclaim of $230.46 would be the first sign that's changing, while a break below $219.81 would open a path toward $201.52 and potentially $188.05.
Disclaimer: This is a technical read based on current chart structure and should not be treated as financial advice. Crypto markets are highly volatile, and prices can move sharply in either direction with little warning. Always do your own research before making any investment decision.
Also read:
2 months ago
TECHY FORCE CYBER RETRIEVAL’s Comprehensive Guide to Recovering Digital Assets from Sophisticated Crypto Scams Cryptocurrency scams continue to affect individuals and businesses worldwide, with victims losing digital assets through fake investment platforms, phishing attacks, romance scams, business email compromise (BEC), ransomware, and other forms of cyber fraud. At TechY Force Cyber Retrieval (TFCR), we help victims fight back through professional blockchain investigations and digital asset recovery services. Website (https://techyforcecyberretrievals.com) WhatsApp (+.1.5.6.1.7.2.6.3.6.9.7) Every case begins with a detailed blockchain transaction analysis and digital forensic investigation. Our cybersecurity professionals trace the movement of stolen cryptocurrency, identify destination wallets and exchanges, and gather digital evidence to develop a recovery strategy tailored to each client’s situation. Using advanced blockchain forensics and investigative techniques, we focus on identifying the parties behind fraudulent transactions and building evidence that supports potential recovery efforts. TechY Force Cyber Retrieval is a registered business headquartered in Michigan, United States, with a team of experienced cybersecurity experts, certified ethical hackers, and blockchain analysts dedicated to investigating cryptocurrency-related financial crime. Throughout every investigation, we maintain strict confidentiality, transparent communication, and realistic expectations about the recovery process. Website (https://techyforcecyberretrievals.com) WhatsApp (+.1.5.6.1.7.2.6.3.6.9.7) What sets us apart is our commitment to our clients through our No Recovery, No Upfront Fee policy. We never charge advance fees for qualifying cases. Instead, our compensation is based on a percentage of successfully recovered assets, ensuring our interests remain aligned with those of the people we serve. If you’ve lost cryptocurrency to online fraud, acting quickly can significantly improve the chances of tracing stolen assets. At TechY Force Cyber Retrieval, we are committed to providing professional, ethical, and evidence-based recovery support to help victims navigate the path toward reclaiming their digital assets.

2 months ago
How to Hire a Hacker to Recover Stolen Bitcoin ; META TECH RECOVERY PRO Top Crypto Recovery Expert in USA Meta Tech Recovery Pro was founded to help victims of crypto theft, cryptocurrency scams, and wallet loss recover their digital assets. We recognize that being defrauded is often accompanied by stress, uncertainty, and long-term disruption, and we approach each case with seriousness, discretion, and measurable progress. Our team combines experienced crypto recovery professionals with blockchain forensics specialists. Using systematic analysis of transaction histories, blockchain patterns, and relevant on-chain and off-chain activity, we trace where stolen funds moved, how wallet access was compromised, and what technical pathways may support restoration. This may include tracing suspicious transfers, mapping associated addresses, evaluating links to exchanges or custodial services, and determining recovery options based on the incident’s specific facts. Reach out to them via the following: - Support (@) metatechrecoverypro (.) com - https://wa.link/5ay4fv - - https://metatechrecoverypro (.) com We emphasize legitimacy, transparency, and responsible practice. Effective recovery requires both technical capability and ethical standards; therefore, we use structured procedures rather than unverifiable promises. We provide victims with clarity on what can be pursued and realistic outcomes, guided by evidence rather than marketing claims. Our services cover: - Lost access to a Bitcoin wallet (forgotten credentials, missing seed phrases, compromised devices, inaccessible keys). - Fraud from romance scams, where attackers manipulate victims into sending cryptocurrency while sustaining deceptive trust. - Defrauding via counterfeit or fake investment platforms, including impersonation of legitimate projects, promises of high returns, and deceptive withdrawal of funds. Timely action is critical, as crypto transactions are often irreversible and stolen funds may be quickly dispersed or converted. We encourage victims to document wallet addresses, transaction IDs, dates, communications, and any platform or contact information as early as possible to enable efficient forensic assessment. Our approach is comprehensive, considering how fraud operates, including tactics used to obscure fund flows, exploit wallet vulnerabilities, or socially engineer victims into approving transfers. By evaluating both behavioral and technical dimensions, we improve the likelihood of locating actionable leads and selecting the most appropriate recovery strategy. Recovery also requires accountability, confidentiality, and a patient, methodical mindset. Whether assets were taken through hacking, misdirection, manipulation, or wallet access loss, our team investigates thoroughly and guides you through the recovery process with professionalism. Meta Tech Recovery Pro is committed to helping victims reclaim what was taken, restore control where possible, and provide informed support throughout a challenging experience.
2 months ago
How to Hire a Hacker to Recover Stolen Bitcoin ; META TECH RECOVERY PRO Top Crypto Recovery Expert in USA Meta Tech Recovery Pro was founded to help victims of crypto theft, cryptocurrency scams, and wallet loss recover their digital assets. We recognize that being defrauded is often accompanied by stress, uncertainty, and long-term disruption, and we approach each case with seriousness, discretion, and measurable progress. Our team combines experienced crypto recovery professionals with blockchain forensics specialists. Using systematic analysis of transaction histories, blockchain patterns, and relevant on-chain and off-chain activity, we trace where stolen funds moved, how wallet access was compromised, and what technical pathways may support restoration. This may include tracing suspicious transfers, mapping associated addresses, evaluating links to exchanges or custodial services, and determining recovery options based on the incident’s specific facts. Reach out to them via the following: - Support (@) metatechrecoverypro (.) com - https://wa.link/5ay4fv - - https://metatechrecoverypro (.) com We emphasize legitimacy, transparency, and responsible practice. Effective recovery requires both technical capability and ethical standards; therefore, we use structured procedures rather than unverifiable promises. We provide victims with clarity on what can be pursued and realistic outcomes, guided by evidence rather than marketing claims. Our services cover: - Lost access to a Bitcoin wallet (forgotten credentials, missing seed phrases, compromised devices, inaccessible keys). - Fraud from romance scams, where attackers manipulate victims into sending cryptocurrency while sustaining deceptive trust. - Defrauding via counterfeit or fake investment platforms, including impersonation of legitimate projects, promises of high returns, and deceptive withdrawal of funds. Timely action is critical, as crypto transactions are often irreversible and stolen funds may be quickly dispersed or converted. We encourage victims to document wallet addresses, transaction IDs, dates, communications, and any platform or contact information as early as possible to enable efficient forensic assessment. Our approach is comprehensive, considering how fraud operates, including tactics used to obscure fund flows, exploit wallet vulnerabilities, or socially engineer victims into approving transfers. By evaluating both behavioral and technical dimensions, we improve the likelihood of locating actionable leads and selecting the most appropriate recovery strategy. Recovery also requires accountability, confidentiality, and a patient, methodical mindset. Whether assets were taken through hacking, misdirection, manipulation, or wallet access loss, our team investigates thoroughly and guides you through the recovery process with professionalism. Meta Tech Recovery Pro is committed to helping victims reclaim what was taken, restore control where possible, and provide informed support throughout a challenging experience.
















