Bitcoin Cash Price Prediction: Is BCH Ready to Recover?


$BCH is trading around $220.80, down more than 5% over the past 24 hours as sellers continue to dominate the market.
With the price approaching a critical zone, traders are closely watching whether Bitcoin Cash can avoid another sharp decline or surprise the market with a reversal.
This Bitcoin Cash price prediction breaks down the key chart signals and price levels that could decide BCH's next move
As per Coinglass Bitcoin Cash Price Right Now,
Metric | Value |
Current Price | $220.80 |
24H Change | -$11.788 (-5.05%) |
Market Cap | $4.42B |
Futures Volume (24H) | $283.38M |
Spot Volume (24H) | $29.60M |
Open Interest | $326.89M |
Circulating Supply | 20.06M BCH |
Total Supply | 20.06M BCH |
Max Supply | 21.00M BCH |
Bitcoin Cash Liquidation Overview
As per CoinGlass liquidation data, long positions are getting hit far harder than shorts across every single timeframe, from the 1-hour window all the way out to 24 hours.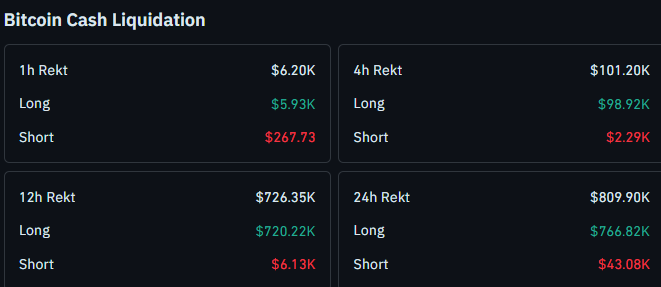
Source: Liquidation data by CoinGlass
This kind of one-sided long liquidation lines up exactly with the price action on the chart, where buyers keep trying to step in and getting flushed out as BCH grinds lower and stamps out new lows.
Bitcoin Cash Technical Analysis: Trendline Rejections Keep Pressure On
On the 1-hour chart, BCH has been stuck under a clean descending trendline for several days now, and the pattern here is pretty unforgiving.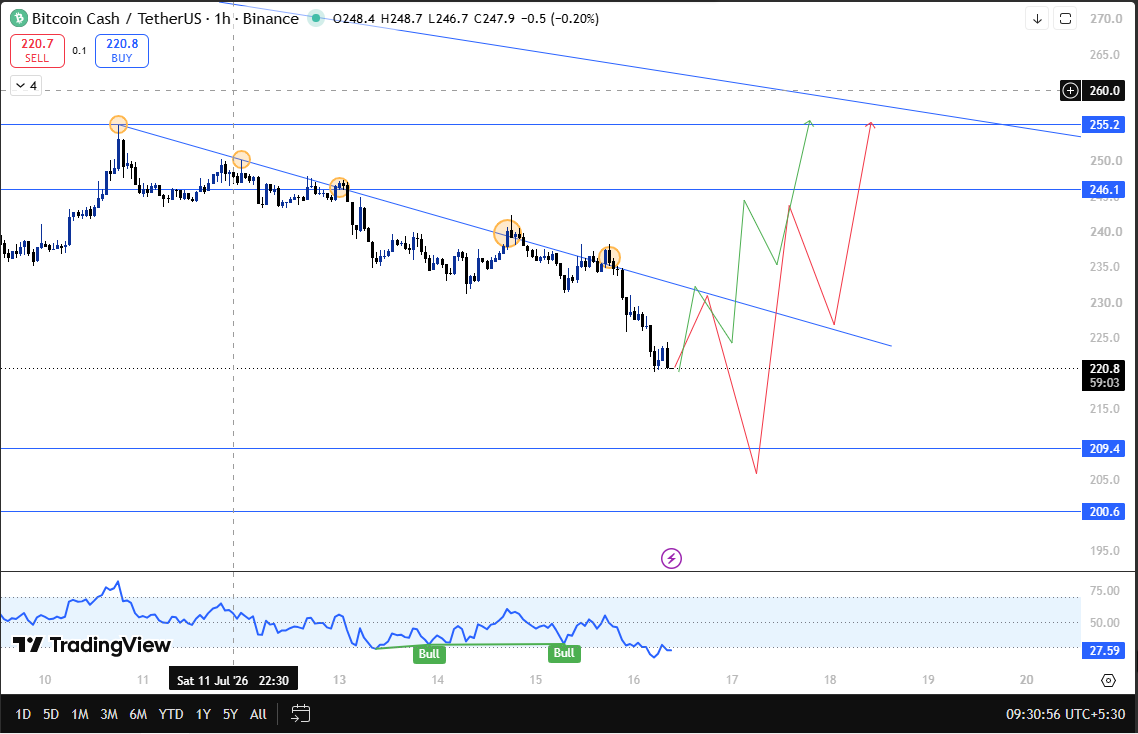
Every single time price climbs up to tap that trendline, it gets rejected and rolls straight back over into a fresh low, and this has repeated itself five times in a row without a single successful break above it.
Each rejection has been slightly lower than the one before it, which is a classic sign of sellers staying firmly in control and buyers not having enough strength yet to flip the structure.
Along with this, RSI on the hourly chart has dropped below the 30 mark, putting BCH in oversold territory.
Normally an oversold reading like this raises the odds of some kind of relief bounce, but as long as the trendline itself keeps holding as resistance, any bounce risks turning into just another lower high.
Below $BCH current price, there are two clear support zones to watch. The first sits at $209.40, and if that gives way, the next one comes in at $200.60.
These are the zones where buying momentum would realistically be expected to show up first, since they have acted as demand areas before.
On the upside, if BCH can finally close above the trendline with real strength and hold that ground, the first resistance to watch comes in at $246.1, and beyond that, $255.2 is the next level that would need to be cleared.
Bitcoin Cash Support and Resistance Levels
Level Type | Price |
Resistance | $255.2 |
Resistance | $246.1 |
Trendline / Breakdown Trigger | Current zone near $220-225 |
Support | $209.4 |
Support | $200.60 |
Risk and Reward: The Honest Version
Factor | Bull Case | Bear Case |
Trendline Breakout | Closes above with strength, opening a path to $246.10 and $255.20. | Rejects again, price slides toward $209.40. |
$209.4 Support | Holds and buying momentum finally kicks in | Breaks down; next support opens at $200.6 |
The analysis above combines short-term chart structure with the latest Bitcoin Cash liquidation data and should not be treated as a guarantee of future performance.
Invalidation Level
This bearish trendline structure stays in control as long as $BCH keeps making lower highs against it and fails to close above it with volume.
On the downside, the setup holds together as long as the price stays above $209.40.
A confirmed break and close below this level would open the door toward $200.6, and losing that zone as well would put BCH into a fresh stretch of price discovery on the lower side.
Expert View
Traders watching $BCH on the lower timeframe are treating this repeated trendline rejection pattern as a warning sign, since five straight failed attempts to break higher usually means sellers are still firmly in charge of the short-term structure.
The RSI slipping below 30 does raise the chances of a short-term bounce, since oversold conditions rarely persist for long without at least a relief move.
With long liquidations dominating every single timeframe in the CoinGlass data, it is clear that buyers attempting to call a bottom have been getting punished repeatedly rather than rewarded.
Most agree that a real change in this Bitcoin Cash price prediction's outlook needs a confirmed close above the descending trendline, while $209.4 and $200.6 remain the levels to watch if the breakdown continues.
Disclaimer: This article is for informational purposes only and should not be considered financial advice. Cryptocurrency markets are highly volatile, and price predictions are not guaranteed. Please do your own research before making any investment decisions.
1 month ago
After losing cryptocurrency to scammers, I searched for help and contacted several recovery firms. Most made bold claims but offered proof of past success, then provided excuses instead of results. suspected many were targeting desperate victims for more money. They later found a service called SYLVESTER BRYANT Recovery, shared transaction records and wallet details, and the service recovered $62,000. contact him YT7cracker@gmail . com and WhatsApp: +1 512 577 7957.

2 months ago
Lost Bitcoin, Ethereum, USDT, or other cryptocurrency to a scam? DIGITAL LIGHT SOLUTION provides professional cryptocurrency investigation and blockchain tracing services for victims of online fraud, fake investment platforms, Romance Crypto Scams, and unauthorized wallet transactions. At DIGITAL LIGHT SOLUTION, our experienced specialists use advanced blockchain analysis to investigate suspicious transactions and help clients understand the options available for pursuing their cases. If you have transaction records, wallet addresses, screenshots, or proof of payment, don't delay. Every detail can be valuable during an investigation. It's not too late to get your money back. Support team available 24/7. Email:digitallightsolution@qualityservice. com and Telegram ——digitallightsolution
2 months ago
How to Hire a Hacker to Recover Stolen Bitcoin ; META TECH RECOVERY PRO Top Crypto Recovery Expert in USA Meta Tech Recovery Pro was founded to help victims of crypto theft, cryptocurrency scams, and wallet loss recover their digital assets. We recognize that being defrauded is often accompanied by stress, uncertainty, and long-term disruption, and we approach each case with seriousness, discretion, and measurable progress. Our team combines experienced crypto recovery professionals with blockchain forensics specialists. Using systematic analysis of transaction histories, blockchain patterns, and relevant on-chain and off-chain activity, we trace where stolen funds moved, how wallet access was compromised, and what technical pathways may support restoration. This may include tracing suspicious transfers, mapping associated addresses, evaluating links to exchanges or custodial services, and determining recovery options based on the incident’s specific facts. Reach out to them via the following: - Support (@) metatechrecoverypro (.) com - https://wa.link/5ay4fv - - https://metatechrecoverypro (.) com We emphasize legitimacy, transparency, and responsible practice. Effective recovery requires both technical capability and ethical standards; therefore, we use structured procedures rather than unverifiable promises. We provide victims with clarity on what can be pursued and realistic outcomes, guided by evidence rather than marketing claims. Our services cover: - Lost access to a Bitcoin wallet (forgotten credentials, missing seed phrases, compromised devices, inaccessible keys). - Fraud from romance scams, where attackers manipulate victims into sending cryptocurrency while sustaining deceptive trust. - Defrauding via counterfeit or fake investment platforms, including impersonation of legitimate projects, promises of high returns, and deceptive withdrawal of funds. Timely action is critical, as crypto transactions are often irreversible and stolen funds may be quickly dispersed or converted. We encourage victims to document wallet addresses, transaction IDs, dates, communications, and any platform or contact information as early as possible to enable efficient forensic assessment. Our approach is comprehensive, considering how fraud operates, including tactics used to obscure fund flows, exploit wallet vulnerabilities, or socially engineer victims into approving transfers. By evaluating both behavioral and technical dimensions, we improve the likelihood of locating actionable leads and selecting the most appropriate recovery strategy. Recovery also requires accountability, confidentiality, and a patient, methodical mindset. Whether assets were taken through hacking, misdirection, manipulation, or wallet access loss, our team investigates thoroughly and guides you through the recovery process with professionalism. Meta Tech Recovery Pro is committed to helping victims reclaim what was taken, restore control where possible, and provide informed support throughout a challenging experience.
2 months ago
How to Hire a Hacker to Recover Stolen Bitcoin ; META TECH RECOVERY PRO Top Crypto Recovery Expert in USA Meta Tech Recovery Pro was founded to help victims of crypto theft, cryptocurrency scams, and wallet loss recover their digital assets. We recognize that being defrauded is often accompanied by stress, uncertainty, and long-term disruption, and we approach each case with seriousness, discretion, and measurable progress. Our team combines experienced crypto recovery professionals with blockchain forensics specialists. Using systematic analysis of transaction histories, blockchain patterns, and relevant on-chain and off-chain activity, we trace where stolen funds moved, how wallet access was compromised, and what technical pathways may support restoration. This may include tracing suspicious transfers, mapping associated addresses, evaluating links to exchanges or custodial services, and determining recovery options based on the incident’s specific facts. Reach out to them via the following: - Support (@) metatechrecoverypro (.) com - https://wa.link/5ay4fv - - https://metatechrecoverypro (.) com We emphasize legitimacy, transparency, and responsible practice. Effective recovery requires both technical capability and ethical standards; therefore, we use structured procedures rather than unverifiable promises. We provide victims with clarity on what can be pursued and realistic outcomes, guided by evidence rather than marketing claims. Our services cover: - Lost access to a Bitcoin wallet (forgotten credentials, missing seed phrases, compromised devices, inaccessible keys). - Fraud from romance scams, where attackers manipulate victims into sending cryptocurrency while sustaining deceptive trust. - Defrauding via counterfeit or fake investment platforms, including impersonation of legitimate projects, promises of high returns, and deceptive withdrawal of funds. Timely action is critical, as crypto transactions are often irreversible and stolen funds may be quickly dispersed or converted. We encourage victims to document wallet addresses, transaction IDs, dates, communications, and any platform or contact information as early as possible to enable efficient forensic assessment. Our approach is comprehensive, considering how fraud operates, including tactics used to obscure fund flows, exploit wallet vulnerabilities, or socially engineer victims into approving transfers. By evaluating both behavioral and technical dimensions, we improve the likelihood of locating actionable leads and selecting the most appropriate recovery strategy. Recovery also requires accountability, confidentiality, and a patient, methodical mindset. Whether assets were taken through hacking, misdirection, manipulation, or wallet access loss, our team investigates thoroughly and guides you through the recovery process with professionalism. Meta Tech Recovery Pro is committed to helping victims reclaim what was taken, restore control where possible, and provide informed support throughout a challenging experience.
2 months ago
After investing a huge portion of my savings about $850,000 USD to fake investment scheme, I soon realized I had been scammed when they refused to let me withdraw any of my funds. At first, I was skeptical about recovering lost Bitcoin, until a friend introduced me to this recovery company and as I speak to you all my funds has been recovered back to me within 24 hours. If you’ve lost money in a crypto scam, don’t give up . Contact them on: recoverydarek@gmail.com they helped me recovered my scammed crypto back to me, they can also be of help to other victims.
















