Bitcoin, Ethereum Price Prediction: Is Money Moving From BTC to ETH?


Ethereum Price Prediction: ETH Holds $1,750 as ETF Money Flows In
Ethereum is sitting at a key spot right now. The Ethereum price prediction picture has shifted this week as money keeps flowing into spot ETH ETFs, even while Bitcoin funds bleed cash.
The altcoin is traded near $1,772 at the time of writing, up about 1.65% on the day.
Is money moving from Bitcoin to Ethereum?
That is the question a lot of traders are asking right now.
On July 8, spot Bitcoin ETFs saw outflows of nearly $85 million. On the same day, spot Ethereum ETFs pulled in a net inflow of $70.48 million.
As per a BSCN tweet, that is not a one-off. ETH funds are now on a five-trading-day inflow streak. Total inflows for July alone have crossed $162 million.
This kind of split, Bitcoin losing money while Ethereum gains it, is often called rotation. Traders sell one asset and buy another. It does not confirm a trend on its own, but it is worth watching.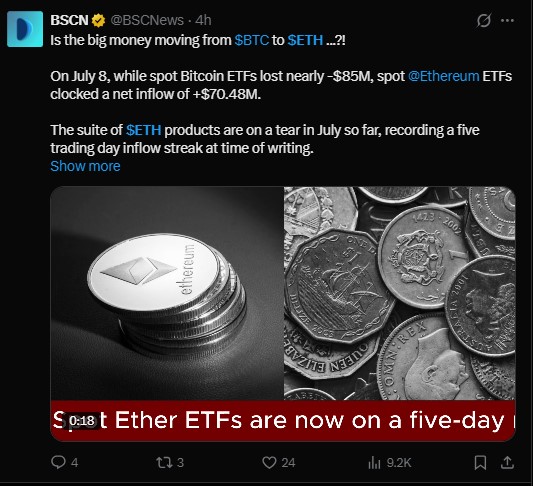
What does the ETH price chart show right now?
Chart watchers are split between two outcomes: a double top or a double bottom.
Looking at the daily chart, ETH fell hard in June, dropping from above $2,500 toward the $1,500 zone. It then bounced, pushing back up near $1,850 before pulling back again.
That move created two possible patterns:
Pattern | Price Zone | What It Means |
Double Top | Near $1,800–$1,850 | Could signal more downside if resistance holds |
Double Bottom | Near $1,500–$1,550 | Could signal a floor and a fresh push higher |
Right now, ETH is holding above $1,750. That level matters a lot for the Ethereum price prediction outlook this week.
As long as the price stays above $1,750, there is a decent chance of a relief rally. A drop back under that mark would put the double top scenario back on the table.
What do ETH derivatives data show?
Futures data adds more context to the price action.
Open interest sits at $24.09 billion, up 0.58%. Options open interest is at $4.60 billion, up 1.83%. Both point to steady, not explosive, positioning.
The long/short ratio on Binance shows 1.90, meaning more traders are leaning long than short. On OKX, the ratio is 1.57, also favoring longs.
Liquidation data tells a rougher story for short-term longs. Over the past 24 hours, long positions lost $8.16 million to liquidations, while shorts lost $24.23 million.
That suggests shorts got squeezed harder recently, which can add fuel to a bounce.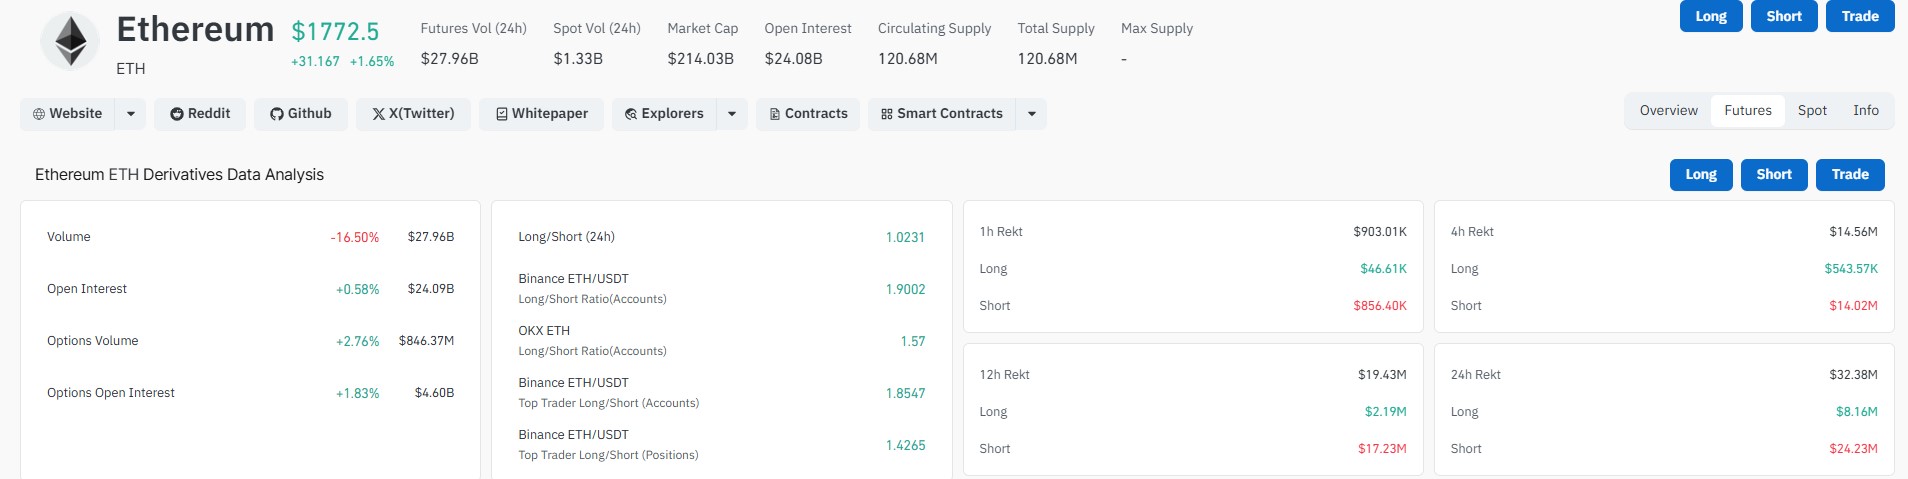
Why some traders think ETH could be repriced
Beyond the charts, there is a bigger argument some analysts are making.
Ethereum is not just a coin. It works as the collateral securing the network. If more stablecoins, tokenized stocks, and real-world assets move onto Ethereum and its Layer-2 networks, the value locked into that security grows too.
The thinking goes like this: if Ethereum becomes the base layer holding trillions of dollars in assets, ETH is the lock protecting that vault. A token doing that job may not trade like a simple gas fee coin anymore.
This is a long-term view, not a short-term price call. It does not guarantee any specific price target.
What to watch next for ETH
A few signals will likely decide what happens next.
RSI is trying to turn upward. MACD is flattening out, which often comes before a shift in momentum. Volume needs to confirm any move for it to hold.
Buyers have kept stepping in near the same support zone for weeks now, instead of letting the structure break down. That has kept the broader trendline analysts have tracked intact.
If buyers build on this, the market structure could improve. If not, this turns into another failed bounce. Confirmation matters more than prediction here.
Disclaimer: This article is for informational purposes only and does not constitute financial, investment, or trading advice. Cryptocurrency markets are highly volatile and risky. Prices can change quickly, and past performance does not guarantee future results. Always do your own research and consult a licensed financial advisor before making any investment decisions.
Also read:

















